Fig. 21
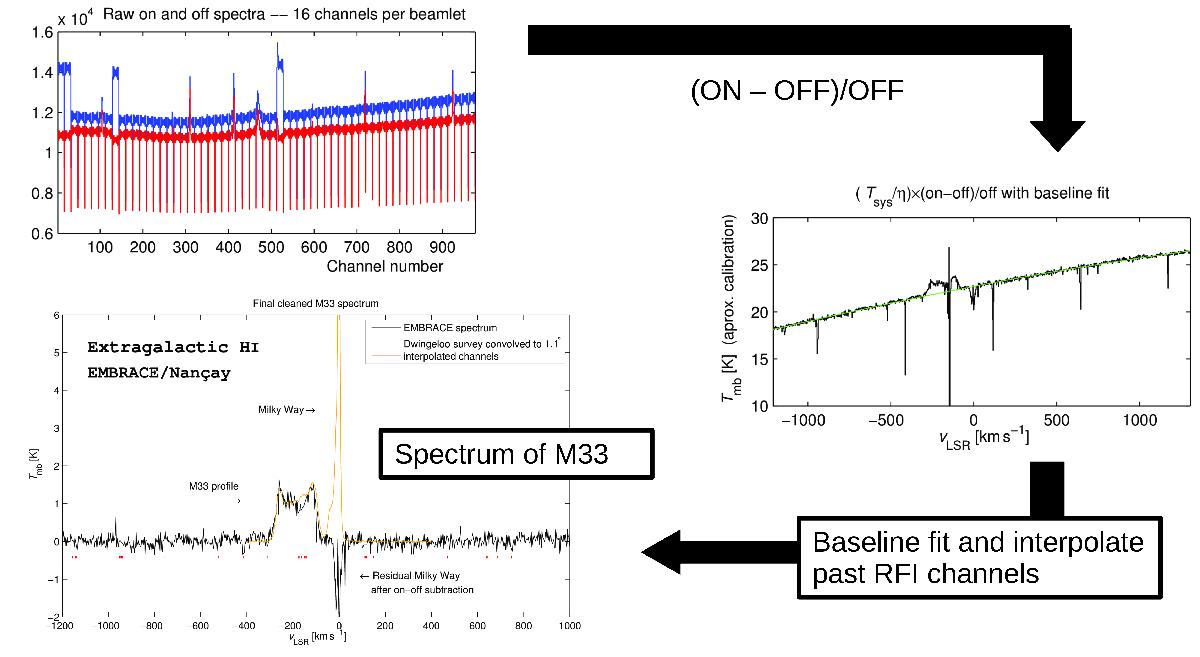
Top left: raw averaged spectra (blue = on, red = off). Note that the horizontal axis has increasing frequency to the right. The galactic foreground is visible in both positions around channel 470. Mid right: coarsely calibrated spectrum with four offset sub-bands corrected by adjusting their level to that of neighbouring sub-bands. Also shown in green is a second order baseline fit. Bottom left: baseline subtracted spectrum where obvious spikes have been interpolated out. A comparison with the LAB survey spectrum is shown in golden/yellow. The detailed line shape agreement is excellent apart from a portion that is obviously asscociated with an unstable sub-band. Note that the galactic foreground has mostly been subtracted out in the EMBRACE spectrum with only a negative residual remaining.
Current usage metrics show cumulative count of Article Views (full-text article views including HTML views, PDF and ePub downloads, according to the available data) and Abstracts Views on Vision4Press platform.
Data correspond to usage on the plateform after 2015. The current usage metrics is available 48-96 hours after online publication and is updated daily on week days.
Initial download of the metrics may take a while.