Fig. 20
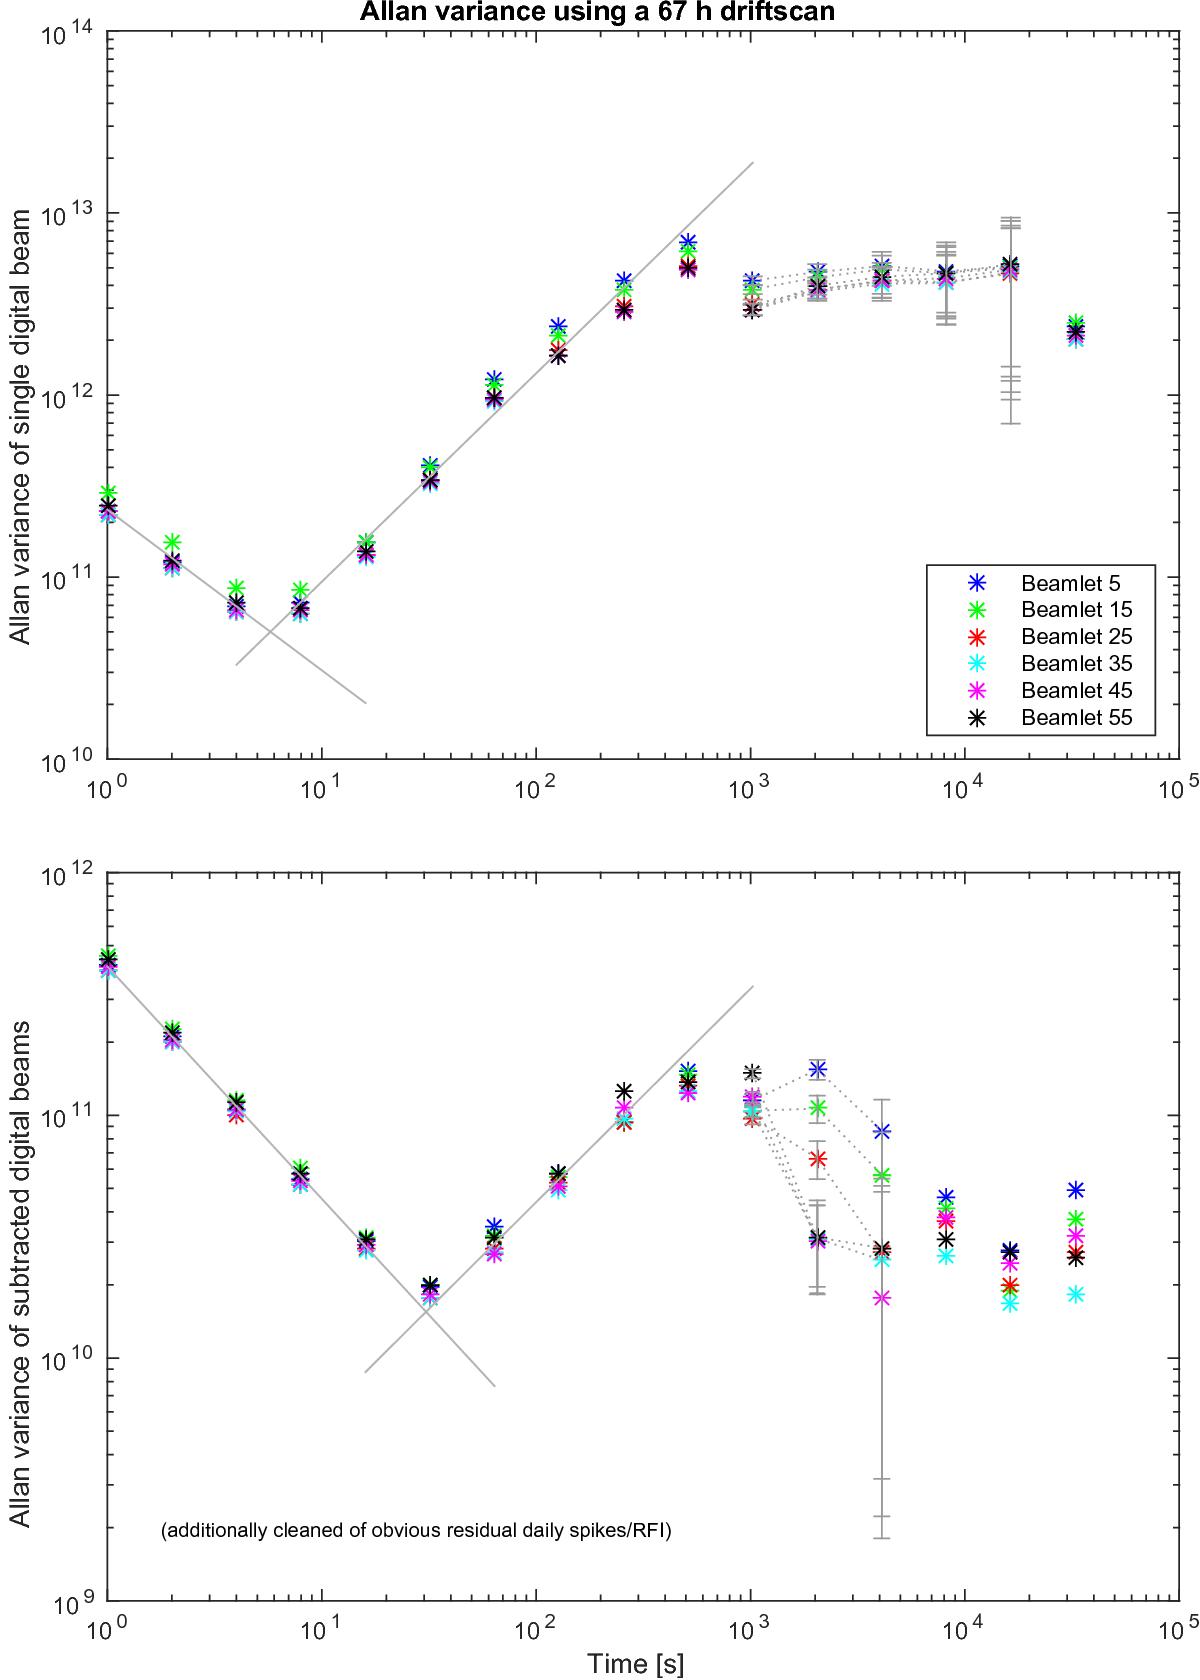
Allan variance as a function of time. This observation was performed as a three-day drift scan of Cas A pointing at ~ 79° elevation due south. The signals from the daily Cas A passages have been removed. In the lower panels also a few strong signals have been removed that occurred on a solar day basis (those could be due to any kind of human activity such as a transmitter that is scheduled to turn on or increase its power for a short while every day, or artificially induced changes to the instrument environment such as variations in the AC power grid).
Current usage metrics show cumulative count of Article Views (full-text article views including HTML views, PDF and ePub downloads, according to the available data) and Abstracts Views on Vision4Press platform.
Data correspond to usage on the plateform after 2015. The current usage metrics is available 48-96 hours after online publication and is updated daily on week days.
Initial download of the metrics may take a while.