Fig. 15
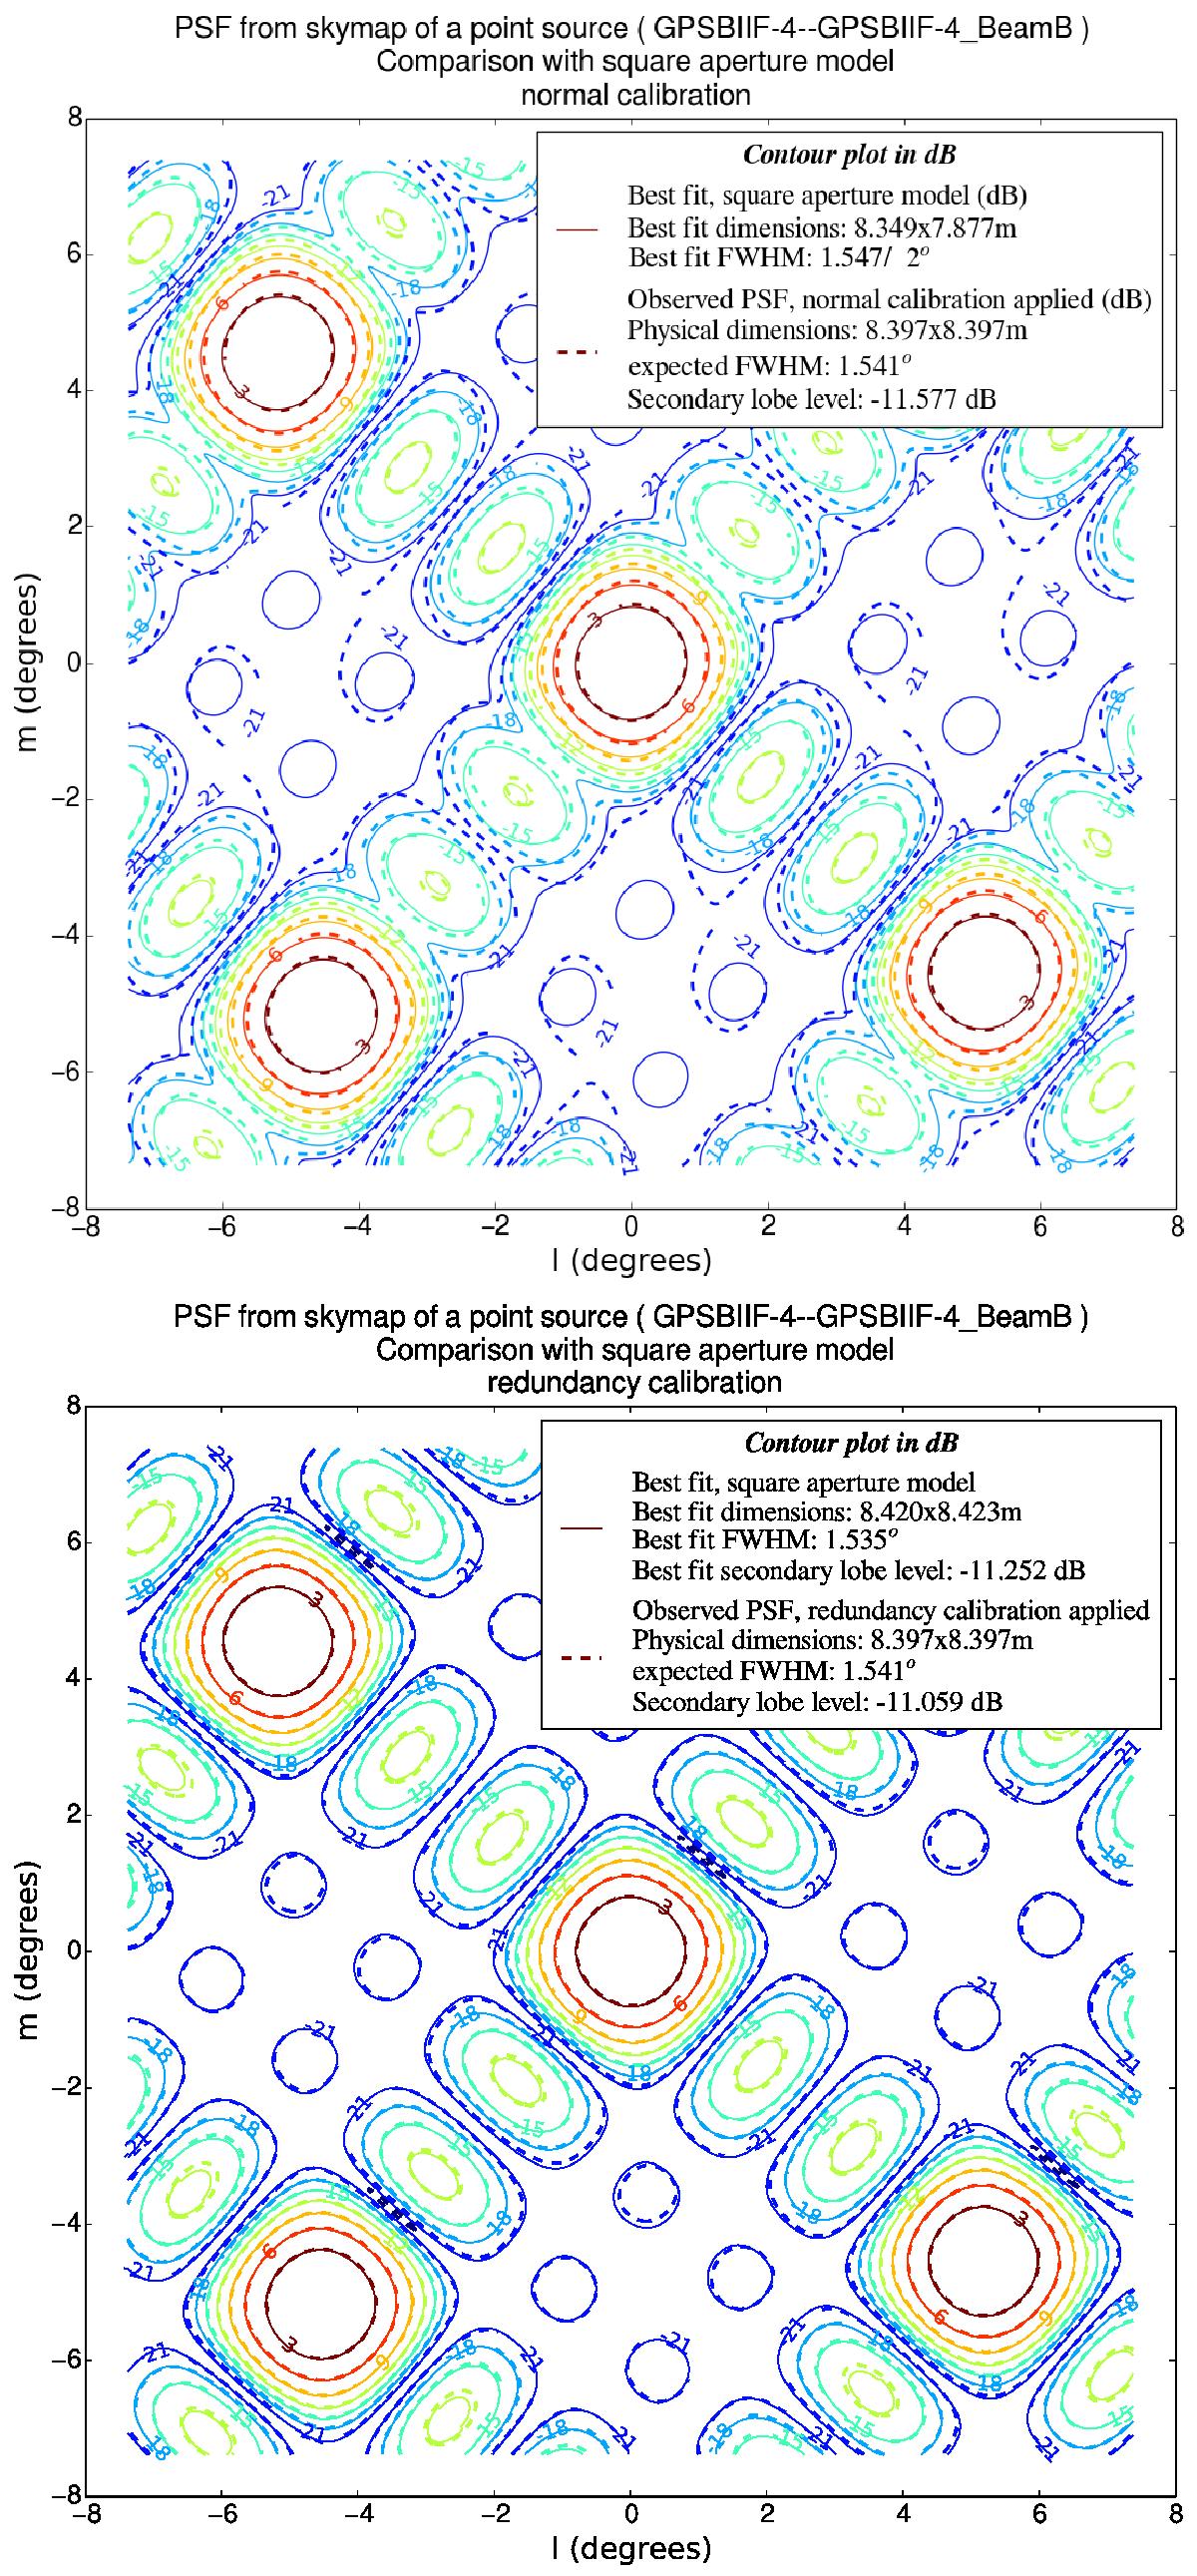
Contour plot (dB scale, 0 at maximum amplitude) of the interferometric imaging in one sub-band and after a phase-only calibration (top panel), and a full redundancy-based calibration (bottom panel), for a GPS satellite observation with EMBRACE@Nançay. Observed data are shown as dashed contours, while the best-fit rectangle aperture model is shown as continuous ones. The periodization of the main pattern is due to sampling of the UV plane, here the equivalent of 3 fields of view is shown.
Current usage metrics show cumulative count of Article Views (full-text article views including HTML views, PDF and ePub downloads, according to the available data) and Abstracts Views on Vision4Press platform.
Data correspond to usage on the plateform after 2015. The current usage metrics is available 48-96 hours after online publication and is updated daily on week days.
Initial download of the metrics may take a while.