Free Access
Fig. 10
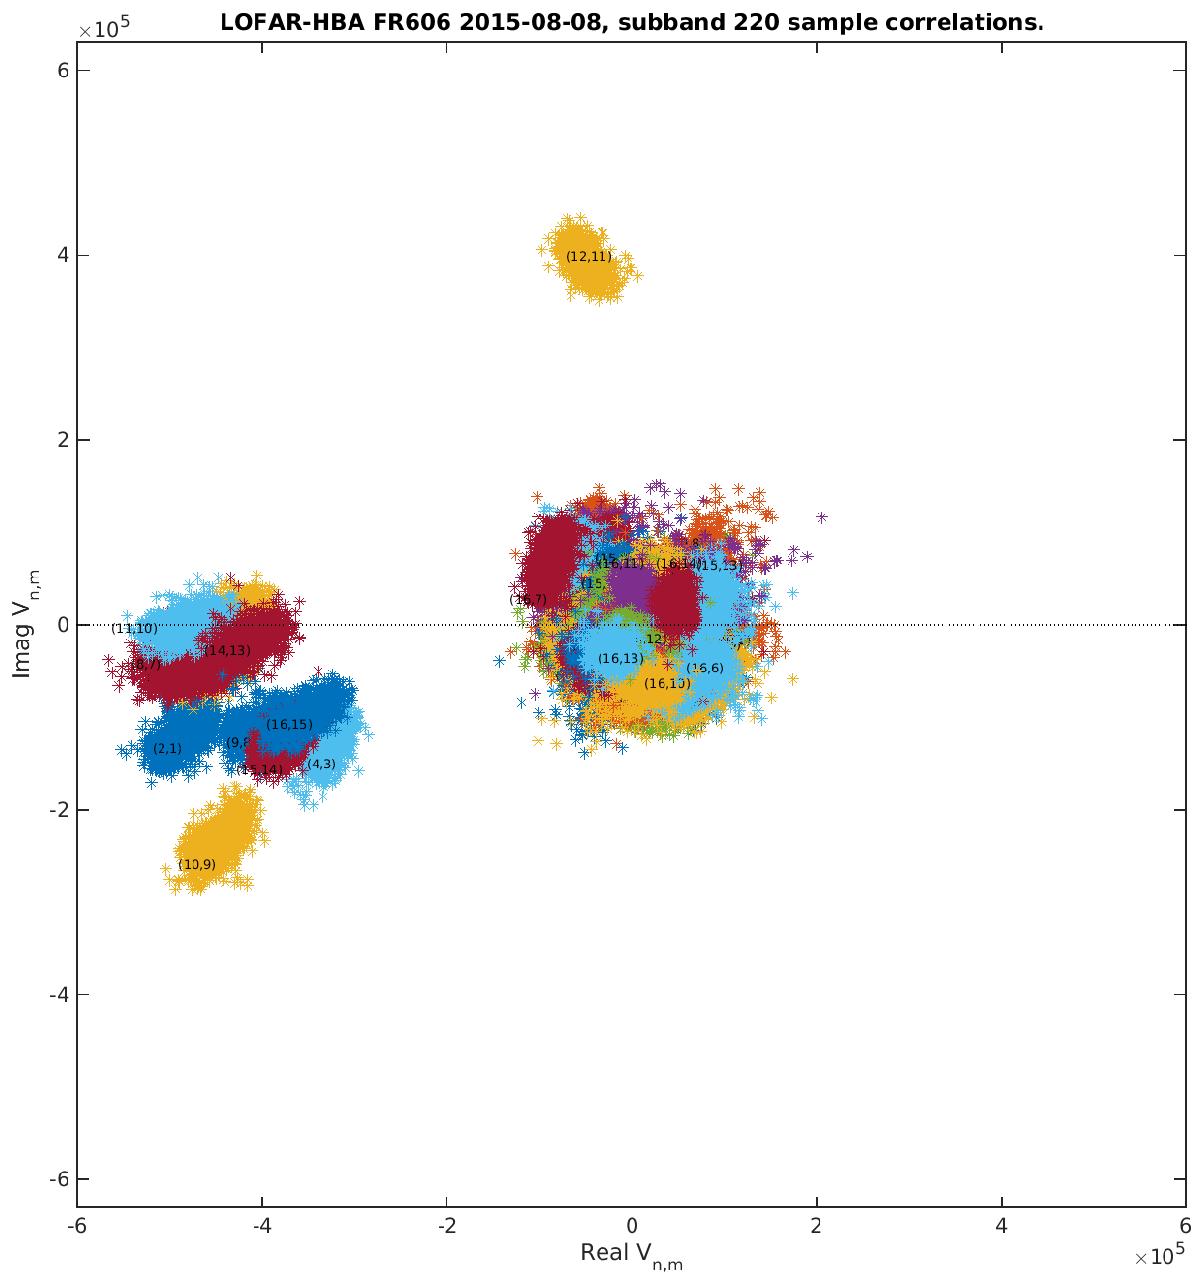
Correlator offset for the High Band Antenna array of the LOFAR station at Nançay. Note that the plot scale is 3 orders of magnitude smaller than the corresponding EMBRACE plot. The outliers are all neighbour antennas indicating the offset is due to cross talk between those antennas.
Current usage metrics show cumulative count of Article Views (full-text article views including HTML views, PDF and ePub downloads, according to the available data) and Abstracts Views on Vision4Press platform.
Data correspond to usage on the plateform after 2015. The current usage metrics is available 48-96 hours after online publication and is updated daily on week days.
Initial download of the metrics may take a while.