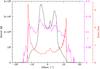
Fig. 7
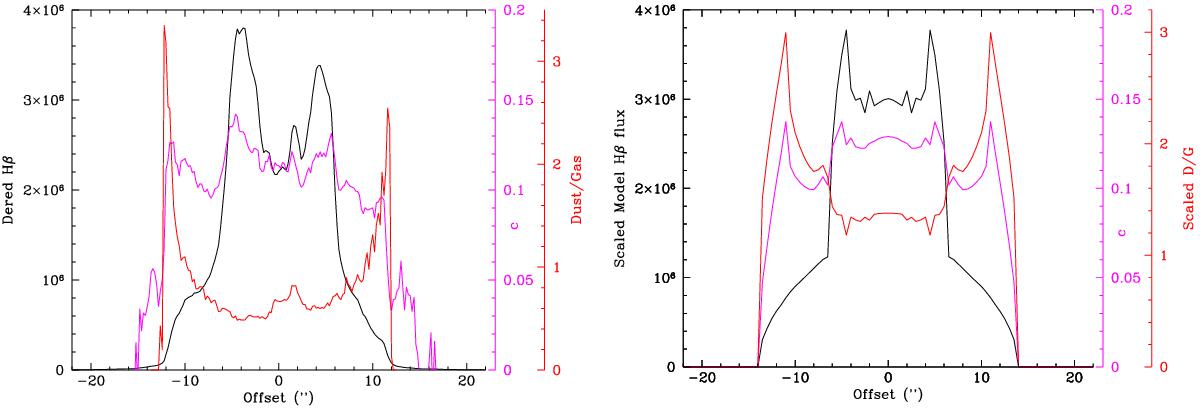
Left: the observed profiles of the Hβ flux (relative units, in black), extinction c (magenta) and dust-to-gas ratio (AV/NH, in red) along a strip 2′′ wide along the minor axis of NGC 7009. The extinction refers to the nebular component and an assumed interstellar component (of c = 0.04) has been subtracted. Right: plausible model profiles of emission (assumed Hβ), extinction c and dust-to-gas ratio (from sums of model gas and dust columns) plotted with scaling and plot symbols similar to the observed profiles. The model consists of two prolate ellipsoidal dust shells; see text for details.
Current usage metrics show cumulative count of Article Views (full-text article views including HTML views, PDF and ePub downloads, according to the available data) and Abstracts Views on Vision4Press platform.
Data correspond to usage on the plateform after 2015. The current usage metrics is available 48-96 hours after online publication and is updated daily on week days.
Initial download of the metrics may take a while.