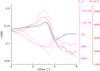
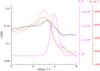
Fig. 4

Collapsed cross sections for the four rim regions displayed in Fig. 2 (a total extent of 25′′), showing the variation of extinction, c, Te (K) and Ne (cm-3) with relative offset across the rim (solid lines). The dashed lines refer to the mean values across the rim region 1, to the NE. Left: cross sections for Ne from the mean value determined from the [S II]6716/6731 Å and [Cl III]5518/5538 Å ratios and Te from the [S III]9069/6312 Å ratio and theoretical Balmer and Paschen line ratios computed for these values. Right: instead of measured Te, an impulse function (Gaussian with FWHM 0.9′′) is used with the observed Ne to compute c from the H line ratios. The size of the temperature excursion (6000 K) was chosen to remove the trough in the extinction.
Current usage metrics show cumulative count of Article Views (full-text article views including HTML views, PDF and ePub downloads, according to the available data) and Abstracts Views on Vision4Press platform.
Data correspond to usage on the plateform after 2015. The current usage metrics is available 48-96 hours after online publication and is updated daily on week days.
Initial download of the metrics may take a while.