| Issue |
A&A
Volume 588, April 2016
|
|
|---|---|---|
| Article Number | A94 | |
| Number of page(s) | 10 | |
| Section | Extragalactic astronomy | |
| DOI | https://doi.org/10.1051/0004-6361/201527851 | |
| Published online | 23 March 2016 | |
A high-redshift quasar absorber without C IV. A galactic outflow caught in the act?
Institut für Physik und Astronomie,
Karl-Liebknecht-Str. 24/25,
14476
Potsdam,
Germany
e-mail:
This email address is being protected from spambots. You need JavaScript enabled to view it.
Received: 27 November 2015
Accepted: 15 February 2016
Abstract
We present a detailed analysis of a very unusual sub-damped Lyman α (sub-DLA) system at redshift z = 2.304 towards the quasar Q 0453−423, based on high signal-to-noise (S/N), high-resolution spectral data obtained with VLT/UVES. With a neutral hydrogen column density of log N(H i) = 19.23 and a metallicity of −1.61 as indicated by [O i/H i] the sub-DLA mimics the properties of many other optically thick absorbers at this redshift. A very unusual feature of this system is, however, the lack of any C iv absorption at the redshift of the neutral hydrogen absorption, although the relevant spectral region is free of line blends and has very high S/N. Instead, we find high-ion absorption from C iv and O vi in another metal absorber at a velocity more than 220 km s-1 redwards of the neutral gas component. We explore the physical conditions in the two different absorption systems using Cloudy photoionisation models. We find that the weakly ionised absorber is dense and metal-poor while the highly ionised system is thin and more metal-rich. The absorber pair towards Q 0453−423 mimics the expected features of a galactic outflow with highly ionised material that moves away with high radial velocities from a (proto)galactic gas disk in which star-formation takes place. We discuss our findings in the context of C iv absorption line statistics at high redshift and compare our results to recent galactic-wind and outflow models.
Key words: intergalactic medium / quasars: absorption lines / galaxies: high-redshift / cosmology: observations
© ESO, 2016
1. Introduction
High-redshift gas clouds in and around galaxies and in the intergalactic medium (IGM) give rise to absorption lines in the spectra of distant background quasars. Since many of these absorption line systems, in particular the strong ones, are thought to be associated with early galaxies, their study provides a useful means to investigate the progenitors of present-day galaxies, being unbiased with respect to distance, luminosity, and morphology of the host galaxies. In the canonical classification scheme, intervening absorbers are classified into four categories according to their neutral hydrogen column density. Gas clouds with neutral hydrogen column densities N(H i) of less than 1017 cm-2 are called Lyman α forest systems (see e.g. Meiksin 2009). Up to 1019 cm-2, the absorbers are called Lyman limit systems (LLSs). Absorption line systems with neutral hydrogen column densities >2 × 1020 cm-2 are called damped Lyman α systems (DLAs) because of the pronounced damping wings that the hydrogen Lyman α absorption line exhibits at these high column densities. DLAs are assumed to be predominantly neutral because of the efficient self-shielding of the gas at such high column densities (Schaye 2001; Nagamine et al. 2010; Yajima et al.; Rahmati et al. 2013). Finally, the sub-damped Lyman α systems (sub-DLAs) comprise the transition between Lyman limit systems and DLAs with column densities 1019 cm-2 ≤ N(H i) ≤ 2 × 1020 cm-2 (Dessauges-Zavadsky et al. 2003; Péroux et al. 2003).
High-column density absorbers usually exhibit a rich spectrum of metal absorption lines from weakly and highly ionised species that can be used to explore the chemical composition as well as the physical conditions in the gas. Compared to other metal ions, absorption from three-times ionised carbon (C iv) seems to be ubiquitous in intervening absorption line systems (Fox et al. 2011). It has been observed in each of these categories of absorber: in DLAs (Rafelski et al. 2012; Fox et al. 2007b; Wolfe et al. 2005; Wolfe & Prochaska 2000; Ellison et al. 2000; Lu et al. 1996), in sub-DLAs (Som et al. 2013; Fox et al. 2007a; Richter et al. 2005; Dessauges-Zavadsky et al. 2003; Péroux et al. 2003) and in LLSs (Prochter et al. 2010; Kirkman & Tytler 1999; Bergeron et al. 1994). Fox et al. (2007a) even state that, in their sample of 63 DLAs and 11 sub-DLAs, no systems were found where C iv absorption is not present. The overall presence of C iv in quasi stellar object (QSO) absorbers is usually interpreted in terms of the presence of diffuse, metal-enriched gas that is photoionised (e.g. by the UV background) or collisionally ionised. In any case, the omnipresence of C iv in QSO absorbers indicates that triply ionised carbon traces a gas phase that is characteristic for many astrophysical gaseous environments.
Highly ionised metal absorption lines far away from galaxies in the IGM could originate from metal enrichment by an early population of stars before the epoch of reionisation, as suggested by Cowie & Songaila (1998), Gnedin & Ostriker (1997) and Madau et al. (2001). Studies of the evolution of the amount of C iv over a large range in redshifts favour this scenario since it is consistent with only a mild or no evolution of the cosmological mass density of C3+ ions (Songaila 2001, 2005; Schaye et al. 2003; Boksenberg et al. 2003; Pettini et al. 2003; Ryan-Weber et al. 2006; Simcoe 2006). Also, Martin et al. (2010) study the size of the metal-enriched regions and argue that the metals must have been deposited by an earlier generation of galaxies. In this so-called early enrichment scenario, the O vi and C iv detections in DLAs indicate the presence of a hot (~106 K) gas phase surrounding the host galaxies. Such hot coronae are predicted to arise by shock heating of gas falling into potential wells (Rees & Ostriker 1977; Davé et al. 2001; Birnboim & Dekel 2003; Kereš et al. 2005; Kang et al. 2005). Studies by Kwak & Shelton (2010) and Fox et al. (2011) suggest a model in which the highly ionised species originate in turbulent mixing layers. In this scenario, these ions trace the radiatively cooling boundary layers between cool (~104 K) clouds and hot (~106 K) plasma. This model can explain the metallicity-independence of the strength of O vi absorption in galaxy haloes (Heckman et al. 2002; Fox 2011), but it does not explain the high-ion kinematics which are generally more extended than the low-ion kinematics.
Alternatively, Adelberger et al. (2005) suggest that large-scale outflows of star-forming galaxies enriched the IGM with highly ionised metals at early times. The compelling evidence for mass outflows from high-redshift galaxies supports this picture (Erb et al. 2006; Steidel et al. 2004; Pettini et al. 2001). A discussion of observational evidence for galactic winds in nearby star-forming and active galaxies and in the high-redshift Universe can be found in Veilleux et al. (2005). Next to observations, simulations of outflows predict the level of ionisation in these winds to be high (Kawata & Rauch 2007; Fangano et al. 2007; Oppenheimer & Davé 2006). Fox et al. (2007a) discuss a scenario in which the star formation activity provides the metals as well as the ionisation energy that is needed to produce the hot ionised gas. Subsequent supernovae and stellar winds inject mechanical energy that causes the observed large line widths of the highly ionised species. Studies by D’Odorico et al. (2010, 2013), Becker et al. (2011) and Ryan-Weber et al. (2009) support this scenario, because they show an increase in the C iv cosmic mass density towards lower redshift and a downturn in the number density of C iv systems towards z = 6. Nevertheless, this is consistent with a decrease in overall metallicity towards higher redshifts.
Galactic-scale superwinds have important consequences for structure-formation (Heckman 2001). Firstly, they are required to regulate star formation in almost all theoretical models of galaxy formation (e.g. Efstathiou 2000). Secondly, they enrich the surroundings of the galaxy and, if the metals remain in a hot phase, they may help to solve the problem of the missing metals at high redshift (Sommer-Larsen & Fynbo 2008; Bouché et al. 2005, 2006, 2007; Ferrara et al. 2005; Pettini 1999; Pagel 1999). Thirdly, the winds cause openings in the interstellar medium of the galaxies which allow Lyman continuum photons to escape and help to reionise the IGM (Steidel et al. 2001).
In this overall context, studies of high-z absorption line systems that exhibit an unusual behaviour with regard to the abundance and kinematics of highly-ionised species such as C iv and O vi represent important bench marks to test the various models and scenarios for diffuse ionised gas in the early Universe and to constrain them.
We present here a detailed study of a sub-DLA at z = 2.304 towards the quasar Q 0453−423, which lacks absorption of C iv, but that is accompanied by a second, redshifted absorber that possibly traces outflowing gas. The remainder of the paper is organised as follows. The data set is described in Sect. 2. We present the results of our analysis of the velocity structure and the ionisation modelling of the different gas phases in Sect. 3. We present possible scenarios for the observed absorption structure in Sect. 4, where we also discuss the implications of our findings. Finally, we summarise our work in Sect. 5.
2. Observations, data handling, and analysis method
The data used in this study are publicly available in the UVES database within ESO’s Science Archive Facility1. They have been obtained in January 2002 as part of the ESO Large Programme 166.A-0106(A) (PI: J. Bergeron). Q 0453−423 was observed through a 1 arcsec slit and the total integration time was 98 786 s. The spectra were recorded at high spectral resolution (R ~ 45 000 or 6.6 km s-1 FWHM) and exhibit a very high S/N of up to ~100 at 5000 Å. The reduction of the raw data has been performed during the UVES Spectral Quasar Absorption Database programme (SQUAD; PI: Michael T. Murphy) using a modified version of the UVES pipeline. The final combined spectrum covers a wavelength range of 3050−10 430 Å.
In the metal absorption system at z = 2.304 towards Q 0453−423, we identify absorption lines arising from 9 different ions (see Fig. 1), namely H i, C ii, O i, Mg ii, Al ii, Si ii, Si iii, Si iv, and Fe ii. It is astonishing that we do not find any C iv absorption within the same redshift range as the weakly ionised species, as the spectral region of the C iv λ1548 line is free from blends and the local S/N per resolution element is as high as 100. There is, however, a much weaker metal absorption system on the same line of sight with a velocity offset of more than 200 km s-1. In that system, we identify H i absorption and weak C iii, C iv, and O vi absorption, but no weakly ionised species and no Si iv (as discussed in detail in Sect. 3).
We have analysed the UVES spectrum using the FITLYMAN package implemented in MIDAS (Fontana & Ballester 1995). Wherever possible, we have fitted absorption lines with coincident redshifts simultaneously. In addition, we have fitted multiple absorption lines of the same ion as multiplet to ensure they have the same column density. For weak or undetected absorption features, we determine the limiting equivalent width based on the local S/N and considering a 3σ detection limit for unsaturated line absorption. This value serves as upper limit except for C ii. Since the C ii absorption is blended, we have derived upper and lower limits by adjusting the continuum in a way that it either includes or excludes all of the blend.
In our analysis, we include statistical errors, which are given by FITLYMAN. We do not account for contributions from errors in continuum placement, systematic uncertainties from fixing of the line centres and b-values, and uncertainties in the atomic data. Throughout the paper we use solar abundances from Asplund et al. (2009) and atomic data from Morton (2003).
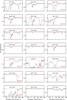 |
Fig. 1 Stacked velocity plot for the absorption system at z = 2.304 toward Q 0453−423. The normalised flux is represented by the black line. Where lines have been fitted, the fit is represented by the red line. Parameters of the fit can be found in Table 1. The figure also indicates which lines are blended. |
3. Results
3.1. Velocity structure
Figure 1 shows absorption lines of all detected ions in this system. In the range of 0–100 km s-1, we find the centre of the strong neutral hydrogen absorption as well as absorption lines of a variety of weakly ionised species: C ii, O i, Mg ii, Al ii, Si ii, and Fe ii. Strikingly, there is no high-ion absorption detected in this velocity interval except for a small amount of Si iv. The C ivλ1550 line is blended. Nevertheless, from the C iv λ1548 panel (6th row in the left column of Fig. 1), it is obvious that there is no C iv absorption in the same velocity range as the weakly ionised species are found down to limiting column density of 1012.1 cm-2. However, we find absorption of C iii, C iv, and O vi well separated from the weakly ionised species by more than 220 km s-1 (zabs = 2.307). There is also neutral hydrogen absorption at this velocity, but no absorption from weakly ionised species.
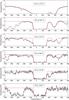 |
Fig. 2 Lyman-series absorption from neutral hydrogen in the sub-DLA at z = 2.304 towards the quasar Q 0453-423. |
Figure 2 shows the Lyman-series absorption from neutral hydrogen absorption for the z = 2.304 absorber, which consists of two components. The multi-component Voigt-profile fit of the absorption lines Lyman α, β, γ, δ, ϵ, and ζ yields column densities of log N(H i) = 19.23 ± 0.01 and log N(H i) = 14.58 ± 0.01 for the blue and the red component, respectively (Table 1). This classifies the z = 2.304 absorber as sub-damped Lyman α system.
3.2. Weakly ionised absorber
For the metal ions, we identify four velocity sub-components at 42 km s-1, 52 km s-1, 84 km s-1, and 105 km s-1, i.e. they span a relatively narrow range of 63 km s-1. The two components at 84 and 105 km s-1 are substantially weaker than the other two components.
Component structure, column densities, and Doppler parameters for the weakly ionised phase of the z = 2.304 absorber towards Q 0453-423.
Only one high ion is seen in absorption at the same redshift as the weakly ionised species. It can be seen in Fig. 1 that the Si iv absorption is very weak and the velocity structure is slightly different from that of the weakly ionised species.
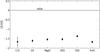 |
Fig. 3 Abundances with respect to solar abundances in the sub-DLA at z = 2.304 towards the quasar Q 0453-423. |
Ion column densities and b-values for the individual components in the weakly-ionised absorber are presented in Table 1. The table also shows upper limits for C iv, Si iv, and Al iii, which correspond to the 3σ detection limits.
Figure 3 shows the metal abundances of the absorption system, estimated from the weakly ionised metal species and averaged over all velocity sub-components (see above) without taking into account any ionisation corrections (see also Table 2). The ionisation conditions in the gas will be discussed in Sect. 4. The metallicity pattern seems fairly smooth except for a slight overabundance of silicon and a slight underabundance of oxygen, but these deviations are not as pronounced as in the system previously analysed by us in Fox et al. (2014).
Total column densities and elemental abundances for the weakly ionised absorber.
3.3. Highly ionised absorber
Figure 1 also shows the absorption profiles of the highly ionised species C iii, C iv, and O vi. A large velocity offset of ≳200 km s-1 is obvious. Furthermore, the narrow velocity range (≲40 km s-1) of the highly ionised species is striking. Previous studies of high ion absorption in DLAs (Lu et al. 1996; Ledoux et al. 1998; Wolfe & Prochaska 2000; Fox et al. 2011) and sub-DLAs (Dessauges-Zavadsky et al. 2003; Péroux et al. 2003; Richter et al. 2005) have found that the high ion profiles generally occupy an overlapping but more extended velocity range than the low ion profiles. This is also evident from Fig. 2 in Fox et al. (2007a), where most of the systems have a C iv total line width ≤500 km s-1 and an absolute velocity offset of ≤150 km s-1.
Also, it is evident from Fig. 1 that O vi shows a different absorption pattern than C iv. This distinct behaviour of O vi has been found in previous studies (e.g. Lehner et al. 2014). Therefore, we decided to determine the O vi column density independently from the carbon fitting. O vi has been fit as a multiplet and carbon has been fit under the assumption that the line centres of C iii and C iv have the same z. The fit is also shown in Fig. 1. We identify three velocity components at 262 km s-1, 286 km s-1, 296 km s-1, i.e. the velocity offset to the bluest component of the weakly ionised species is 220 km s-1. Measured column densities and b-values for the highly ionised species are listed in Table 3. The total column densities and upper limits of the high ion lines can be found in Table 4. To verify our results, we have additionally measured the equivalent width of the O vi absorption line and, under the assumption of an optically thin line, we have deduced from that a total column density of log N(O vi) = 13.80, which is slightly lower than what has been determined by Voigt profile fitting.
Component structure, column densities, and Doppler parameters for the highly ionised absorber towards Q 0453-423.
Total column densities for the highly ionised phase.
4. Cloudy modelling
4.1. Model setup
In order to test how much C iv we can expect in a gas characterised by this pattern of weakly ionised metals, we have carried out photoionisation models using version 13.03 of the Cloudy photoionisation code (Ferland et al. 1998). We have assumed the incident ionising radiation field to be composed of the cosmic background radiation and a Haardt & Madau (2012) UV background (Haardt & Madau 2012), both evaluated at the redshift of the absorber and scaled to log F(ν) = −20.3608 at 1.0 Ryd. Here, F(ν) = 4πJ(ν), where J(ν) is the mean intensity of the incident radiation field per unit solid angle, given in erg s-1 Hz-1 cm-2. We modelled a plane-parallel slab of photoionised gas and varied the hydrogen density nH between 10-5.0 and 10-0.4 cm-3 in steps of 10-0.2 cm-3. The temperature was left as a free parameter.
The simulations were stopped once the observed total H i column density was reached. We scaled down the overall metallicity in the model to 2.5% solar which corresponds to the measured [O i/H i]. This value has been adopted as starting value for the models’ metallicity because of the strong connection between O i and H i through charge-exchange reactions. For our final model, we chose the hydrogen density and metallicity that reproduce the observations best, i.e., that are consistent with the column densities determined from the observations. For this absorption system, we have considered the total column densities and have not tried to model each component individually since the metallicity pattern is similar in the individual components. However, we have set up a separate model for the highly ionised gas with the significant velocity offset.
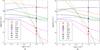 |
Fig. 4 Cloudy models for the weakly ionised metal species in the absorption line system at z = 2.304. The lines represent the Cloudy predictions for the column densities versus the gas density log nH, with the observations (symbols) plotted at best-fit value of log nH as indicated by the vertical grey line. The correlation between the symbols and the lines is shown in the keys in the lower left corners. The error bars are in most cases smaller than the symbol itself. For C iv and Al iii upper limits are indicated as explained in the text. a) Metallicity of 2.5% solar. b) Metallicity of 2.5% solar, but (C/H) =−4.07 which corresponds to [C/O]=−0.5. |
4.2. Weakly ionised absorber
Figure 4 shows the Cloudy models for the weakly ionised gas phase based on the initial metallicity assumption of 2.5% solar metallicity. Upper limits are given for Al iii and C iv. They correspond to the detection limit. Since the C ii line is blended, we give an estimate of the maximum and the minimum amount of C ii in the system, including or excluding the blend, respectively. In either case, it is obvious that Cloudy predicts more C ii than we observe. Therefore, we have deciced to reduce the carbon abundance to correspond to [C/O] =−0.5, as is commonly observed in DLAs (Fox et al. 2007c, 2011; Cooke et al. 2011; Pettini et al. 2008) and in low-metallicity stars in the Galactic halo (Akerman et al. 2004). This model is represented in Fig. 4b. Now, the observed carbon and oxygen column densities match the Cloudy predicitions. The remaining ion species show minor discrepancies that can have various reason as we discussed in Fox et al. (2014). In any case, it is obvious that the hydrogen density of this gas cloud must be relatively high, nH ≳ 10-1.5 cm-3. This density limit is comparable to the densities found in warm neutral gas in the disk and halo of the Milky Way (Richter et al. 2009). The total hydrogen column density in the cloud is calculated to log N(H)= 19.94, from which we derive an absorber size of d = N(H)/nH = 892 pc. At the chosen hydrogen density, the temperature in the gas is constrained to T ≈ 1.3 × 10⁴ K.
4.3. Highly ionised gas absorber
Figure 5 shows the Cloudy model for the highly ionised gas phase. For this model, the initial metallicity assumption had to be varied and increased up to 17% solar metallicity. The simulations were stopped at a hydrogen column density of log N(H i)= 14.58, which has been measured for the redward hydrogen component as seen in Fig. 2. The total hydrogen column density is log N(H)= 18.59, while the best matching density for this absorber is (nH ≈ 10-3.2 cm-3). These numbers indicate an absorber size of d = 2.0 kpc. In Fig. 5, upper limits are given for Si iii and Si iv. The C iii line is most likely blended, so the errors can be larger than indicated by the FITLYMAN fits.
O vi does not match the Cloudy model. In fact, it has often been found that O vi does not reside in the same gas phase as C iv and Si iv (Fox et al. 2007b, 2011; Lehner et al. 2008). The column density of O vi can be explained by the presence of a shock-heated gas phase with a temperature of T = 1.5 × 10⁶ K, where only a minimum amount of hydrogen is substracted from the C iv gas phase.
From our modelling, we find that the metallicity of the highly ionised phase is not the same as in the weakly ionised phase. It is generally higher and a carbon-oxygen-ratio of −0.5 does not match the observations in the highly ionised absorber.
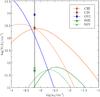 |
Fig. 5 Cloudy model for the highly ionised metal species in the absorption line system at z = 2.304. The lines represent the Cloudy predictions and the symbols the measured values. The correlation between the symbols and the lines is shown in the key in the upper right corner. For Si iii and Si iv upper limits are indicated as explained in the text. The error on the C iii column density is propably larger than indicated because of possible line blending. The vertical grey line indicates the hydrogen density that causes the smallest discrepancies between the Cloudy predictions and the measured values. |
5. Discussion
5.1. Constraints on physical conditions
The lack of significant C iv absorption in the z = 2.304 sub-DLA towards Q 0453−423 is a very unusual feature for an intervening absorption system at this large gas-column density. This aspect thus requires further consideration.
It is the intrinsic nature of basically all extended interstellar and intergalactic gas structures that they exhibit an intrinsic distribution of gas densities that may span several orders of magnitudes. As a result of ionisation and recombination processes, such density variations result in the formation of spatially distinct gas phases that coexist within the same superordinate structure. Abrupt changes in the gas density are not expected for a cosmic gaseous structure being in a steady state because of mixing processes in the boundary layers between high-density and low-density regions. In fact, it has been suggested that a considerable fraction of intervening high-ion absorbers trace exactly such mixing layers (Fox et al. 2011), indicating the widespread presence of multi-phase intergalactic and circumgalactic gas at low and high redshifts.
The absorber at z = 2.304 towards Q 0453−423 obviously lacks such a boundary layer, while highly-ionised gas is redshifted by more than 220 km s-1. This clearly indicates that the gas very recently must have experienced some kind of dynamic event that has led to the kinematic separation of the different gas phases.
With the density and temperature constraints of from the Cloudy modelling, the thermal pressure in the weakly ionised component is restricted to P/k ≳ 387 cm-3 K, where k is Boltzmann’s constant. Assuming that the gas is in pressure equilibrium (confined by gravity and/or by an ambient medium), this value suggests that the absorber is located deep within a potential well of a galaxy-size dark-matter halo.
If the gas would be over-pressured for some reasons, however, it would expand to reach such pressure equilibrium. The relevant time scale is the free expansion time scale, texp, which is defined by the ratio between absorber size, d, and the sound speed in the gas, cs. As shown by Schaye et al. (2007), texp can be parametrised for intergalactic conditions in the form 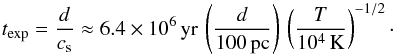 (1)In our case, d = 892 pc, so that with T = 1.3 × 10⁴ K we obtain texp ≈ 4.9 × 10⁷ yr, which is very small compared to the Hubble time. However, if the structure would expand within an ambient medium with a smooth pressure gradient, it would be destroyed on a similarly short timescale due to Rayleigh-Taylor and Kelvin-Helmholtz instabilities (Schaye et al. 2007). Therefore, such an object would be very short-lived. A similar problem has been reported by Crighton et al. (2015).
With these physical boundary conditions in mind, we explore subsequently possible scenarios for the origin of the absorber at z = 2.304 towards Q 0453−423.
5.2. Possible origins of the absorbing gas
5.2.1. Stripping (A)
The weakly ionised absorber at z = 2.304 might trace a dense cloud, whose ionised envelope has been stripped away by ram-pressure forces as the cloud is moving through an ambient (hot) medium. In this scenario, a cold gas clump (e.g. gas infalling from the IGM) moves through hot coronal (circumgalactic) gas that fills the potential well of a galaxy (or galaxy group; see Fig. 6A). The weakly ionised absorber would represent the (cold) cloud core, while the redshifted highly-ionised absorber would represent the former cloud envelope that has been stripped away. The higher metallicity of the stripped material then could be explained by mixing processes of the gas with the ambient coronal gas that would need to be metal rich.
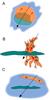 |
Fig. 6 Possible scenarios that could explain the observed absorption. |
While such processes do play an important role for high-density environments in the cosmic web (such as in galaxy clusters; e.g. Ebeling et al. 2013), ram pressure stripping in lower-density gas environments such as in galaxy halos is expected to be less efficient, as pram ∝ ρgas. The most severe drawback of this model is, however, the very large velocity difference between the cold cloud core and the stripped envelope of more than 220 km s-1, which is far beyond any realistic velocity difference expected for gas-stripping processes in diffuse gas environments in galaxy halos or galaxy groups. In view of this aspect, the stripping model appears highly unlikely to explain the observed properties of the sub-DLA towards Q 0453−423.
5.2.2. Galactic outflow (B)
The weakly ionised absorber at z = 2.304 might represent a neutral gas disk of a galaxy, in which star-formation activity drives an outflow of ionised gas into the galaxy’s halo. In this scenario (see Fig. 6B), we think of the central gas region of a galaxy with active star formation. Highly ionised, metal enriched gas might break through the gas layers if supernova explosions provide sufficient mechanical energy, as described in Fox et al. (2007a). A correlation of intergalactic C iv absorption and outflows from star-forming galaxies has already been suggested by previous studies, e.g. Adelberger et al. (2005). If we assume that the sightline passes nearly perpendicular through the neutral disk and along the galactic outflow, we would expect an absorption pattern that mimics the one seen in the absorber pair near z = 2.304 towards Q 0453−423: a dense and weakly-ionised absorber (gas disk) and highly ionised gas (outflowing material) that has a significant velocity offset due to the large wind velocity.
From our Cloudy modelling, we have estimated an absorber thickness for the weakly ionised absorber of 892 pc. This relative small number fits well to the values expected for the neutral gas disks of galaxies, in particular if part of the more diffuse neutral gas at the disk boundaries would be removed from the disk by the outflow. Note that with the density and temperature constraints from our Cloudy model the absorbing gas would be regarded as warm neutral medium (WNM).
Now, that we have identified the neutral phase in this absorber with the inner neutral parts of some form of galaxy, can we identify the highly ionised phase with a galactic wind?
Previous absorption line studies have measured or inferred outflow speeds of starburst-driven galactic superwinds that range from a few 102 to 103 km s-1 (Heckman 2001). Steidel et al. (2004) find bulk outflow speeds of 200−300 km s-1 to be common for galactic scale winds in star-forming galaxies at z ≤ 3. Bouché et al. (2012) find outflow speeds to be 150−300 km s-1 at z = 0. They trace outflows by Mg ii absorption and claim that the outflow speeds are lower than the escape velocity of the observed galaxies. At intermediate redshifts, Martin et al. (2012) measure outflow speeds at redshifts 0.4−1.4 to be roughly 200 km s-1, as inferred from low-ion absorption lines. Also, simulations show that galactic winds can reach velocities of ~500 km s-1 (Cen 2012) and cause multiphase gas layers with distinct temperatures (Cooper et al. 2008). These wind velocities match the velocity difference between the weakly-ionised and highly-ionised absorbers in our spectrum.
The idea of a galactic wind is further supported by the detection of Doppler-shifted O vi absorption, which is in line with previous findings of Aracil et al. (2004). These authors show that O vi absorption is often located within ~300 km s-1 of strong H i lines, suggesting that the O vi lines originate in winds flowing away from overdense regions. Also, Lehner et al. (2014) hypothesize that O vi absorbers at 2 <z ≲ 3.5 probe outflows of star-forming galaxies. However, in their study they have exclusively been looking for absorbers with log NH i> 17.3. It is especially interesting that for every clear non-detection of O vi, they do not detect C iv either.
On the other hand, Songaila (2006) shows that only half of the higher column density C iv systems have velocity widths that might be produced directly by outflows. She argues that C iv absorption lines arising in galaxy outflows should show large velocity widths of about 300−400 km s-1. The rest of the higher column density systems and all the lower column density systems must lie in the more general intergalactic medium (see also Fox et al. 2007a). However, both narrow and broad C iv absorption components could trace wind material if the outflowing (and swept-up material from the disk) is clumpy, as indicated by outflowing gas in low-redshift starburst galaxies (e.g. Leroy et al. 2015; Roche et al. 2015; Martin & Bouché 2009).
Note that in our wind scenario the sightline would pass through hot coronal halo gas on both sides of the disk. The question arises, why there is no C iv absorption stemming from the disk-halo interface or from outflowing (blueshifted) gas on the other side (near side) of the disk? The answer might again lie in an inhomogeneous density and temperature distribution of the outflowing material such that by chance only the redshifted outflowing material is dense and cold enough to be traced by C iv and O vi, while the blueshifted outflowing material along the sightline is too hot and/or too thin to be picked up in absorption.
5.2.3. Circumgalactic gas flow (C)
The highly ionised absorber at z = 2.304 might represent warm/hot gas that resides in the circumgalactic environment of a galaxy whose neutral gas disk is traced by the weakly ionised absorption component.
In this scenario, the highly ionised absorption component may represent a stream of warm/hot gas at larger distances than in the previous scenario, either inside or outside the virial radius of the host galaxy. The velocity offset between the weakly and highly ionised gas would then be a result of the relative motion of the warm/hot gas with respect to the galaxy, for instance as part of an accretion flow from the IGM. The presence of such warm/hot circumgalactic gas flows around galaxies/DLAs/sub-DLAs is well established at low and high redshift (e.g. Simcoe et al. 2002; Stocke et al. 2006; Prochaska et al. 2006; Fox et al. 2007b; Lehner et al. 2008; Wakker & Savage 2009). Also for our Galaxy, FUV observations of O vi indicate the widespread presence of highly ionised gas features in the inner and outer halo of the Milky Way with velocity separation of several hundred km s-1 with respect to the disk gas (Sembach et al. 2003; Wakker et al. 2003). While the general setup of such a gas distribution (cold disk and warm CGM, kinematically separated by a few hundred km s-1) is plausible in view of the role of the circumgalactic medium for the growth and evolution of galaxies, the drawback of this scenario is that it alone does not explain the lack of a C iv absorbing gas phase in the disk-halo interface region. Even more critical is the observed higher metallicity of the highly ionised gas compared to the weakly ionised absorber, which would be difficult to explain if the highly ionised gas is accreted from outside the virial radius of the host galaxy (e.g. from the IGM). We conclude that, in view of these arguments, the circumgalactic gas flow model is less convincing than the outflow model. In summary, the outflow model (B) represents the most realistic scenario that can explain all the observed properties of the absorber pair at z = 2.304 towards Q 0453−423 based on realistic assumptions.
5.3. Implications
A search of the literature reveals that this is not the first absorption system without C iv absorption that has been found, but it is the first spectrum with this high S/N and which has been analysed in this detail:
-
Petitjean et al. (1994) find an absorption line system with neither Si iv nor C iv absorption at a redshift of z = 2.033 towards PKS 0424-131. Their signal-to-noise is 20−50. They argue that the sightline passes through a low carbon but enhanced oxygen region.
-
Ledoux et al. (1998) find an absorption system at z = 3.151 towards Q 2233+131 in which the strongest C iv absorption is located in a gap between two low-ionisation components.
-
Petitjean et al. (2002) study a damped Lyman α absorber with molecular hydrogen and a complex velocity pattern. Some velocity components are only seen in low ion absorption. It is noteworthy that most of the Si iv and C iv absorption is located in between the two main low-ionisation systems.
-
Péroux et al. (2003) find a sub-DLA system where the highly ionised phase does not overlap with the weakly ionised phase, even though the velocity offset is just ~70 km s-1.
-
Péroux et al. (2006) study an extremely metal-rich sub-DLA which shows no third ionisation stages at all. They determine that the gas in this system is predominantly neutral.
-
Péroux et al. (2007) find an absorption system at z = 3.665 with Si iv but without C iv detection even though the region of the spectrum where the C iv is expected is noisy.
-
In a survey of low-ionisation metal absorption systems at z ~ 6, Becker et al. (2011) discover a lack of strong C iv and Si iv absorption. However, their spectra are of modest quality at these far-red wavelengths and the lack of highly ionised metals is still consistent with an overall low metallicity of the systems at these redshifts.
-
In the first results of the KODIAQ survey, Lehner et al. (2014) find three absorption systems without C iv absorption, even though their S/N is lower than in the spectrum analysed here. Besides, they find 8 systems where the C iv absorption is offset from the low ion absorption, sometimes by more than 200 km s-1.
6. Summary
We have analysed in detail a sub-damped Lyman α absorber at z = 2.304 towards Q 0453–423 that shows a variety of weakly ionised metal species, but surprisingly no C iv absorption in the same velocity range. This is not the first absorption system without C iv absorption that has been found, but it is the first spectrum with a S/N of up to ~100 that has been analysed in such detail.
A gas phase with highly ionised species is observed at a velocity offset of more than 220 km s-1. For both gas phases, we have reproduced the shape of the absorption lines by Voigt profile fitting and analysed the physical conditions in the gas with the help of Cloudy photoionisation models. They show that the gas in the weakly ionised gas phase must be very dense (nH> 10-1.5 cm-3), metalpoor (2.5% solar), and resemble warm neutral gas in the disk and halo of the Milky Way. By contrast, the gas in the highly ionised phase must be thinner (nH ≈ 10-3.2 cm-3) and more metal rich (~17% solar). The abundance patterns of the two gas phases seem to be distinct.
We discuss three different scenarios that could explain the observed abundance pattern, taking into consideration that the physical conditions in the weakly ionised phase would result in a very short live span of such a cloud. We conclude that an outflow model, where a galactic wind flows away from a dense region with active star-formation, represents a plausible scenario that can explain the observed properties of the absorber pair.
The detection of absorption line systems without C iv absorption challenges our interpretation of highly ionised gas in optically thick H i absorbers in quasar spectra and requires further study.
Acknowledgments
The authors would like to thank Michael T. Murphy for providing the reduced VLT/UVES data set of Q 0453−423. A.F. is grateful for financial support from the Leibniz Graduate School for Quantitative Spectroscopy in Astrophysics, a joint project of the Leibniz Institute for Astrophysics Potsdam (AIP) and the Institute of Physics and Astronomy of the University of Potsdam (UP). She would also like to thank Andrew Fox, Céline Péroux, and Nicolas Lehner for helpful discussions.
References
- Adelberger, K. L., Shapley, A. E., Steidel, C. C., et al. 2005, ApJ, 629, 636 [NASA ADS] [CrossRef] [Google Scholar]
- Akerman, C. J., Carigi, L., Nissen, P. E., Pettini, M., & Asplund, M. 2004, A&A, 414, 931 [NASA ADS] [CrossRef] [EDP Sciences] [Google Scholar]
- Aracil, B., Petitjean, P., Pichon, C., & Bergeron, J. 2004, A&A, 419, 811 [NASA ADS] [CrossRef] [EDP Sciences] [Google Scholar]
- Asplund, M., Grevesse, N., Sauval, A. J., & Scott, P. 2009, ARA&A, 47, 481 [NASA ADS] [CrossRef] [Google Scholar]
- Becker, G. D., Sargent, W. L. W., Rauch, M., & Calverley, A. P. 2011, ApJ, 735, 93 [NASA ADS] [CrossRef] [Google Scholar]
- Bergeron, J., Petitjean, P., Sargent, W. L. W., et al. 1994, ApJ, 436, 33 [NASA ADS] [CrossRef] [Google Scholar]
- Birnboim, Y., & Dekel, A. 2003, MNRAS, 345, 349 [NASA ADS] [CrossRef] [Google Scholar]
- Boksenberg, A., Sargent, W. L. W., & Rauch, M. 2003, ArXiv e-prints [arXiv:astro-ph/0307557] [Google Scholar]
- Bouché, N., Lehnert, M. D., & Péroux, C. 2005, MNRAS, 364, 319 [NASA ADS] [CrossRef] [Google Scholar]
- Bouché, N., Lehnert, M. D., & Péroux, C. 2006, MNRAS, 367, L16 [NASA ADS] [Google Scholar]
- Bouché, N., Lehnert, M. D., Aguirre, A., Péroux, C., & Bergeron, J. 2007, MNRAS, 378, 525 [NASA ADS] [CrossRef] [Google Scholar]
- Bouché, N., Hohensee, W., Vargas, R., et al. 2012, MNRAS, 426, 801 [NASA ADS] [CrossRef] [Google Scholar]
- Cen, R. 2012, ApJ, 748, 121 [NASA ADS] [CrossRef] [Google Scholar]
- Cooke, R., Pettini, M., Steidel, C. C., Rudie, G. C., & Nissen, P. E. 2011, MNRAS, 417, 1534 [NASA ADS] [CrossRef] [Google Scholar]
- Cooper, J. L., Bicknell, G. V., Sutherland, R. S., & Bland-Hawthorn, J. 2008, ApJ, 674, 157 [NASA ADS] [CrossRef] [Google Scholar]
- Cowie, L. L., & Songaila, A. 1998, Nature, 394, 44 [NASA ADS] [CrossRef] [Google Scholar]
- Crighton, N. H. M., Hennawi, J. F., Simcoe, R. A., et al. 2015, MNRAS, 446, 18 [NASA ADS] [CrossRef] [Google Scholar]
- Davé, R., Cen, R., Ostriker, J. P., et al. 2001, ApJ, 552, 473 [NASA ADS] [CrossRef] [Google Scholar]
- Dessauges-Zavadsky, M., Péroux, C., Kim, T.-S., D’Odorico, S., & McMahon, R. G. 2003, MNRAS, 345, 447 [NASA ADS] [CrossRef] [Google Scholar]
- D’Odorico, V., Calura, F., Cristiani, S., & Viel, M. 2010, MNRAS, 401, 2715 [NASA ADS] [CrossRef] [Google Scholar]
- D’Odorico, V., Cupani, G., Cristiani, S., et al. 2013, MNRAS, 435, 1198 [NASA ADS] [CrossRef] [Google Scholar]
- Ebeling, H., Edge, A. C., Burgett, W. S., et al. 2013, MNRAS, 432, 62 [NASA ADS] [CrossRef] [Google Scholar]
- Efstathiou, G. 2000, MNRAS, 317, 697 [NASA ADS] [CrossRef] [Google Scholar]
- Ellison, S. L., Songaila, A., Schaye, J., & Pettini, M. 2000, AJ, 120, 1175 [NASA ADS] [CrossRef] [Google Scholar]
- Erb, D. K., Shapley, A. E., Pettini, M., et al. 2006, ApJ, 644, 813 [NASA ADS] [CrossRef] [Google Scholar]
- Fangano, A. P. M., Ferrara, A., & Richter, P. 2007, MNRAS, 381, 469 [NASA ADS] [CrossRef] [Google Scholar]
- Ferland, G. J., Korista, K. T., Verner, D. A., et al. 1998, PASP, 110, 761 [Google Scholar]
- Ferrara, A., Scannapieco, E., & Bergeron, J. 2005, ApJ, 634, L37 [NASA ADS] [CrossRef] [Google Scholar]
- Fontana, A., & Ballester, P. 1995, The Messenger, 80, 37 [NASA ADS] [Google Scholar]
- Fox, A. J. 2011, ApJ, 730, 58 [NASA ADS] [CrossRef] [Google Scholar]
- Fox, A. J., Ledoux, C., Petitjean, P., & Srianand, R. 2007a, A&A, 473, 791 [Google Scholar]
- Fox, A. J., Petitjean, P., Ledoux, C., & Srianand, R. 2007b, A&A, 465, 171 [NASA ADS] [CrossRef] [EDP Sciences] [Google Scholar]
- Fox, A. J., Petitjean, P., Ledoux, C., & Srianand, R. 2007c, ApJ, 668, L15 [NASA ADS] [CrossRef] [Google Scholar]
- Fox, A. J., Ledoux, C., Petitjean, P., Srianand, R., & Guimarães, R. 2011, A&A, 534, A82 [NASA ADS] [CrossRef] [EDP Sciences] [Google Scholar]
- Fox, A., Richter, P., & Fechner, C. 2014, A&A, 572, A102 [NASA ADS] [CrossRef] [EDP Sciences] [Google Scholar]
- Gnedin, N. Y., & Ostriker, J. P. 1997, ApJ, 486, 581 [NASA ADS] [CrossRef] [Google Scholar]
- Haardt, F., & Madau, P. 2012, ApJ, 746, 125 [NASA ADS] [CrossRef] [Google Scholar]
- Heckman, T. M. 2001, in Gas and Galaxy Evolution, eds. J. E. Hibbard, M. Rupen, & J. H. van Gorkom, ASP Conf. Ser., 240, 345 [Google Scholar]
- Heckman, T. M., Norman, C. A., Strickland, D. K., & Sembach, K. R. 2002, ApJ, 577, 691 [NASA ADS] [CrossRef] [Google Scholar]
- Kang, H., Ryu, D., Cen, R., & Song, D. 2005, ApJ, 620, 21 [NASA ADS] [CrossRef] [Google Scholar]
- Kawata, D., & Rauch, M. 2007, ApJ, 663, 38 [NASA ADS] [CrossRef] [Google Scholar]
- Kereš, D., Katz, N., Weinberg, D. H., & Davé, R. 2005, MNRAS, 363, 2 [NASA ADS] [CrossRef] [Google Scholar]
- Kirkman, D., & Tytler, D. 1999, ApJ, 512, L5 [NASA ADS] [CrossRef] [Google Scholar]
- Kwak, K., & Shelton, R. L. 2010, ApJ, 719, 523 [NASA ADS] [CrossRef] [Google Scholar]
- Ledoux, C., Petitjean, P., Bergeron, J., Wampler, E. J., & Srianand, R. 1998, A&A, 337, 51 [NASA ADS] [Google Scholar]
- Lehner, N., Howk, J. C., Prochaska, J. X., & Wolfe, A. M. 2008, MNRAS, 390, 2 [NASA ADS] [CrossRef] [Google Scholar]
- Lehner, N., O’Meara, J. M., Fox, A. J., et al. 2014, ApJ, 788, 119 [NASA ADS] [CrossRef] [Google Scholar]
- Leroy, A. K., Walter, F., Martini, P., et al. 2015, ApJ, 814, 83 [NASA ADS] [CrossRef] [Google Scholar]
- Lu, L., Sargent, W. L. W., Barlow, T. A., Churchill, C. W., & Vogt, S. S. 1996, ApJS, 107, 475 [NASA ADS] [CrossRef] [Google Scholar]
- Madau, P., Ferrara, A., & Rees, M. J. 2001, ApJ, 555, 92 [NASA ADS] [CrossRef] [Google Scholar]
- Martin, C. L., & Bouché, N. 2009, ApJ, 703, 1394 [NASA ADS] [CrossRef] [Google Scholar]
- Martin, C. L., Scannapieco, E., Ellison, S. L., et al. 2010, ApJ, 721, 174 [NASA ADS] [CrossRef] [Google Scholar]
- Martin, C. L., Shapley, A. E., Coil, A. L., et al. 2012, ApJ, 760, 127 [NASA ADS] [CrossRef] [Google Scholar]
- Meiksin, A. A. 2009, Rev. Mod. Phys., 81, 1405 [NASA ADS] [CrossRef] [Google Scholar]
- Morton, D. C. 2003, ApJS, 149, 205 [NASA ADS] [CrossRef] [MathSciNet] [Google Scholar]
- Nagamine, K., Choi, J.-H., & Yajima, H. 2010, ApJ, 725, L219 [NASA ADS] [CrossRef] [Google Scholar]
- Oppenheimer, B. D., & Davé, R. 2006, MNRAS, 373, 1265 [NASA ADS] [CrossRef] [Google Scholar]
- Pagel, B. E. J. 1999, ArXiv e-prints [arXiv:astro-ph/9911204] [Google Scholar]
- Péroux, C., Dessauges-Zavadsky, M., D’Odorico, S., Kim, T.-S., & McMahon, R. G. 2003, MNRAS, 345, 480 [NASA ADS] [CrossRef] [Google Scholar]
- Péroux, C., Kulkarni, V. P., Meiring, J., et al. 2006, A&A, 450, 53 [NASA ADS] [CrossRef] [EDP Sciences] [Google Scholar]
- Péroux, C., Dessauges-Zavadsky, M., D’Odorico, S., Kim, T.-S., & McMahon, R. G. 2007, MNRAS, 382, 177 [NASA ADS] [CrossRef] [Google Scholar]
- Petitjean, P., Rauch, M., & Carswell, R. F. 1994, A&A, 291, 29 [NASA ADS] [Google Scholar]
- Petitjean, P., Srianand, R., & Ledoux, C. 2002, MNRAS, 332, 383 [NASA ADS] [CrossRef] [Google Scholar]
- Pettini, M. 1999, in Chemical Evolution from Zero to High Redshift, Proc. ESO, eds. J. R. Walsh, & M. R. Rosa, 233 [Google Scholar]
- Pettini, M., Shapley, A. E., Steidel, C. C., et al. 2001, ApJ, 554, 981 [NASA ADS] [CrossRef] [Google Scholar]
- Pettini, M., Madau, P., Bolte, M., et al. 2003, ApJ, 594, 695 [NASA ADS] [CrossRef] [Google Scholar]
- Pettini, M., Zych, B. J., Steidel, C. C., & Chaffee, F. H. 2008, MNRAS, 385, 2011 [NASA ADS] [CrossRef] [Google Scholar]
- Prochaska, J. X., Weiner, B. J., Chen, H.-W., & Mulchaey, J. S. 2006, ApJ, 643, 680 [NASA ADS] [CrossRef] [Google Scholar]
- Prochter, G. E., Prochaska, J. X., O’Meara, J. M., Burles, S., & Bernstein, R. A. 2010, ApJ, 708, 1221 [NASA ADS] [CrossRef] [Google Scholar]
- Rafelski, M., Wolfe, A. M., Prochaska, J. X., Neeleman, M., & Mendez, A. J. 2012, ApJ, 755, 89 [NASA ADS] [CrossRef] [Google Scholar]
- Rahmati, A., Pawlik, A. H., Raicevic, M., & Schaye, J. 2013, MNRAS, 430, 2427 [NASA ADS] [CrossRef] [Google Scholar]
- Rees, M. J., & Ostriker, J. P. 1977, MNRAS, 179, 541 [NASA ADS] [CrossRef] [Google Scholar]
- Richter, P., Ledoux, C., Petitjean, P., & Bergeron, J. 2005, A&A, 440, 819 [NASA ADS] [CrossRef] [EDP Sciences] [Google Scholar]
- Richter, P., Charlton, J. C., Fangano, A. P. M., Bekhti, N. B., & Masiero, J. R. 2009, ApJ, 695, 1631 [NASA ADS] [CrossRef] [Google Scholar]
- Roche, N., Humphrey, A., Gomes, J. M., et al. 2015, MNRAS, 453, 2349 [NASA ADS] [CrossRef] [Google Scholar]
- Ryan-Weber, E. V., Pettini, M., & Madau, P. 2006, MNRAS, 371, L78 [NASA ADS] [CrossRef] [Google Scholar]
- Ryan-Weber, E. V., Pettini, M., Madau, P., & Zych, B. J. 2009, MNRAS, 395, 1476 [NASA ADS] [CrossRef] [Google Scholar]
- Schaye, J. 2001, ApJ, 562, L95 [NASA ADS] [CrossRef] [Google Scholar]
- Schaye, J., Aguirre, A., Kim, T.-S., et al. 2003, ApJ, 596, 768 [NASA ADS] [CrossRef] [Google Scholar]
- Schaye, J., Carswell, R. F., & Kim, T.-S. 2007, MNRAS, 379, 1169 [NASA ADS] [CrossRef] [Google Scholar]
- Sembach, K. R., Wakker, B. P., Savage, B. D., et al. 2003, ApJS, 146, 165 [NASA ADS] [CrossRef] [Google Scholar]
- Simcoe, R. A. 2006, ApJ, 653, 977 [NASA ADS] [CrossRef] [Google Scholar]
- Simcoe, R. A., Sargent, W. L. W., & Rauch, M. 2002, ApJ, 578, 737 [NASA ADS] [CrossRef] [Google Scholar]
- Som, D., Kulkarni, V. P., Meiring, J., et al. 2013, MNRAS, 435, 1469 [NASA ADS] [CrossRef] [Google Scholar]
- Sommer-Larsen, J., & Fynbo, J. P. U. 2008, MNRAS, 385, 3 [NASA ADS] [CrossRef] [Google Scholar]
- Songaila, A. 2001, ApJ, 561, L153 [NASA ADS] [CrossRef] [Google Scholar]
- Songaila, A. 2005, AJ, 130, 1996 [NASA ADS] [CrossRef] [Google Scholar]
- Songaila, A. 2006, AJ, 131, 24 [NASA ADS] [CrossRef] [Google Scholar]
- Steidel, C. C., Pettini, M., & Adelberger, K. L. 2001, ApJ, 546, 665 [NASA ADS] [CrossRef] [Google Scholar]
- Steidel, C. C., Shapley, A. E., Pettini, M., et al. 2004, ApJ, 604, 534 [NASA ADS] [CrossRef] [Google Scholar]
- Stocke, J. T., Penton, S. V., Danforth, C. W., et al. 2006, ApJ, 641, 217 [NASA ADS] [CrossRef] [Google Scholar]
- Veilleux, S., Cecil, G., & Bland-Hawthorn, J. 2005, ARA&A, 43, 769 [Google Scholar]
- Wakker, B. P., & Savage, B. D. 2009, ApJS, 182, 378 [NASA ADS] [CrossRef] [Google Scholar]
- Wakker, B. P., Savage, B. D., Sembach, K. R., et al. 2003, ApJS, 146, 1 [NASA ADS] [CrossRef] [Google Scholar]
- Wolfe, A. M., & Prochaska, J. X. 2000, ApJ, 545, 591 [NASA ADS] [CrossRef] [Google Scholar]
- Wolfe, A. M., Gawiser, E., & Prochaska, J. X. 2005, ARA&A, 43, 861 [NASA ADS] [CrossRef] [MathSciNet] [Google Scholar]
- Yajima, H., Choi, J.-H., & Nagamine, K. 2012, MNRAS, 427, 2889 [NASA ADS] [CrossRef] [Google Scholar]
All Tables
Component structure, column densities, and Doppler parameters for the weakly ionised phase of the z = 2.304 absorber towards Q 0453-423.
Component structure, column densities, and Doppler parameters for the highly ionised absorber towards Q 0453-423.
All Figures
|
Fig. 1 Stacked velocity plot for the absorption system at z = 2.304 toward Q 0453−423. The normalised flux is represented by the black line. Where lines have been fitted, the fit is represented by the red line. Parameters of the fit can be found in Table 1. The figure also indicates which lines are blended. |
| In the text | |
|
Fig. 2 Lyman-series absorption from neutral hydrogen in the sub-DLA at z = 2.304 towards the quasar Q 0453-423. |
| In the text | |
|
Fig. 3 Abundances with respect to solar abundances in the sub-DLA at z = 2.304 towards the quasar Q 0453-423. |
| In the text | |
|
Fig. 4 Cloudy models for the weakly ionised metal species in the absorption line system at z = 2.304. The lines represent the Cloudy predictions for the column densities versus the gas density log nH, with the observations (symbols) plotted at best-fit value of log nH as indicated by the vertical grey line. The correlation between the symbols and the lines is shown in the keys in the lower left corners. The error bars are in most cases smaller than the symbol itself. For C iv and Al iii upper limits are indicated as explained in the text. a) Metallicity of 2.5% solar. b) Metallicity of 2.5% solar, but (C/H) =−4.07 which corresponds to [C/O]=−0.5. |
| In the text | |
|
Fig. 5 Cloudy model for the highly ionised metal species in the absorption line system at z = 2.304. The lines represent the Cloudy predictions and the symbols the measured values. The correlation between the symbols and the lines is shown in the key in the upper right corner. For Si iii and Si iv upper limits are indicated as explained in the text. The error on the C iii column density is propably larger than indicated because of possible line blending. The vertical grey line indicates the hydrogen density that causes the smallest discrepancies between the Cloudy predictions and the measured values. |
| In the text | |
|
Fig. 6 Possible scenarios that could explain the observed absorption. |
| In the text | |
Current usage metrics show cumulative count of Article Views (full-text article views including HTML views, PDF and ePub downloads, according to the available data) and Abstracts Views on Vision4Press platform.
Data correspond to usage on the plateform after 2015. The current usage metrics is available 48-96 hours after online publication and is updated daily on week days.
Initial download of the metrics may take a while.