Fig. 4
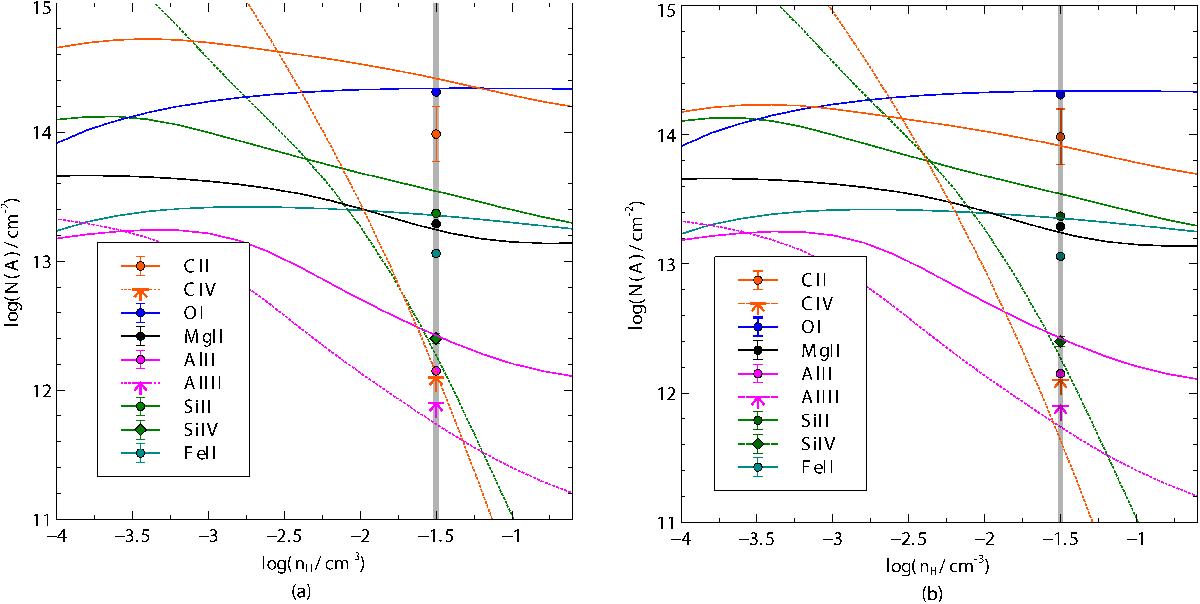
Cloudy models for the weakly ionised metal species in the absorption line system at z = 2.304. The lines represent the Cloudy predictions for the column densities versus the gas density log nH, with the observations (symbols) plotted at best-fit value of log nH as indicated by the vertical grey line. The correlation between the symbols and the lines is shown in the keys in the lower left corners. The error bars are in most cases smaller than the symbol itself. For C iv and Al iii upper limits are indicated as explained in the text. a) Metallicity of 2.5% solar. b) Metallicity of 2.5% solar, but (C/H) =−4.07 which corresponds to [C/O]=−0.5.
Current usage metrics show cumulative count of Article Views (full-text article views including HTML views, PDF and ePub downloads, according to the available data) and Abstracts Views on Vision4Press platform.
Data correspond to usage on the plateform after 2015. The current usage metrics is available 48-96 hours after online publication and is updated daily on week days.
Initial download of the metrics may take a while.