Fig. 5
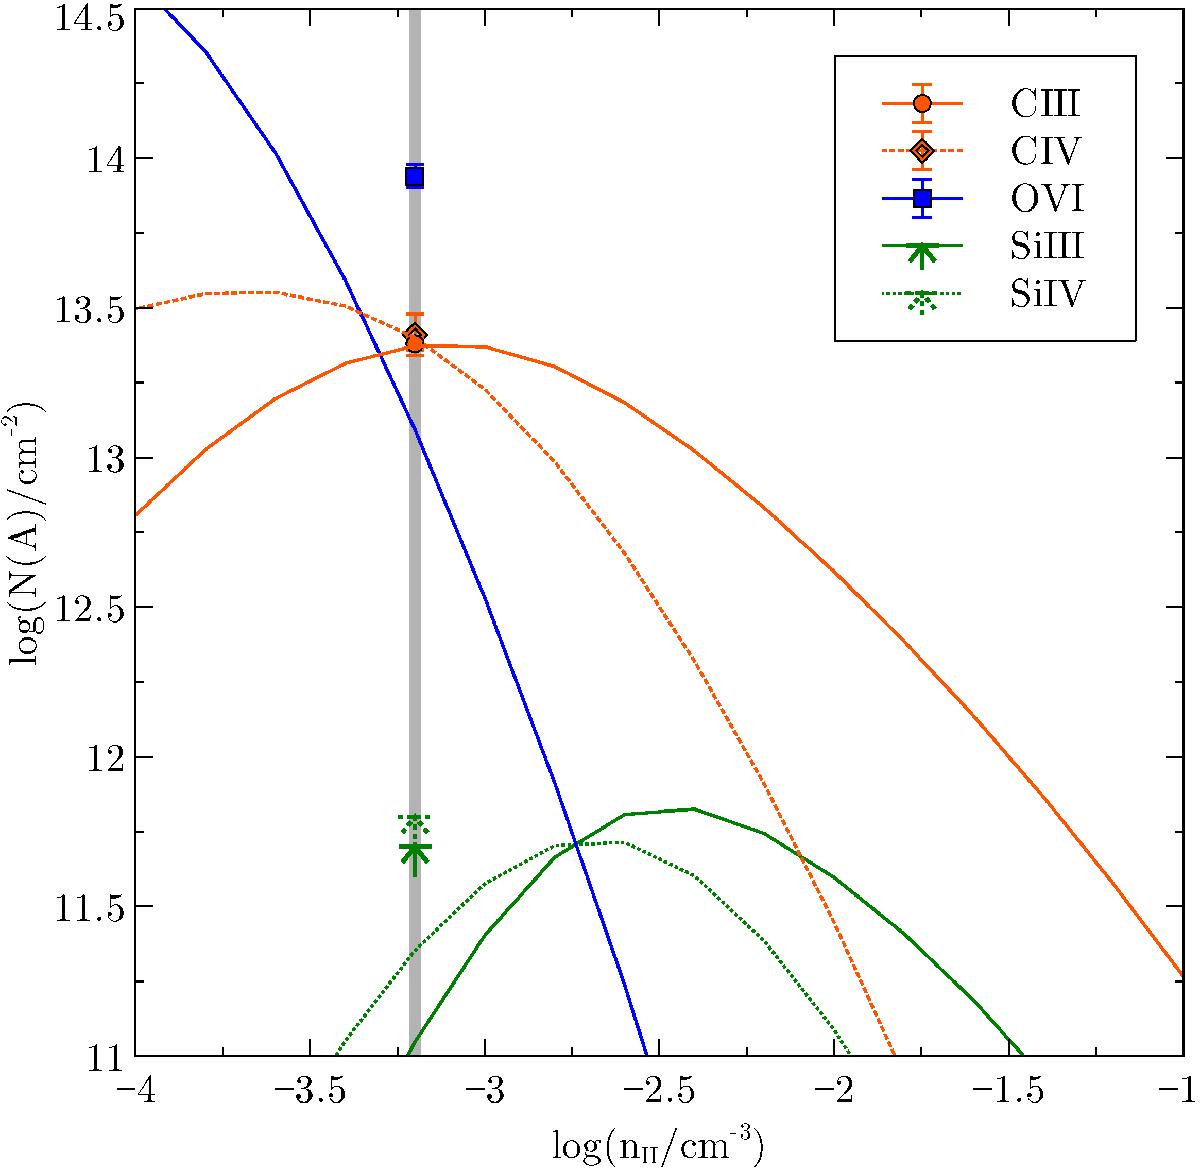
Cloudy model for the highly ionised metal species in the absorption line system at z = 2.304. The lines represent the Cloudy predictions and the symbols the measured values. The correlation between the symbols and the lines is shown in the key in the upper right corner. For Si iii and Si iv upper limits are indicated as explained in the text. The error on the C iii column density is propably larger than indicated because of possible line blending. The vertical grey line indicates the hydrogen density that causes the smallest discrepancies between the Cloudy predictions and the measured values.
Current usage metrics show cumulative count of Article Views (full-text article views including HTML views, PDF and ePub downloads, according to the available data) and Abstracts Views on Vision4Press platform.
Data correspond to usage on the plateform after 2015. The current usage metrics is available 48-96 hours after online publication and is updated daily on week days.
Initial download of the metrics may take a while.