Fig. 7
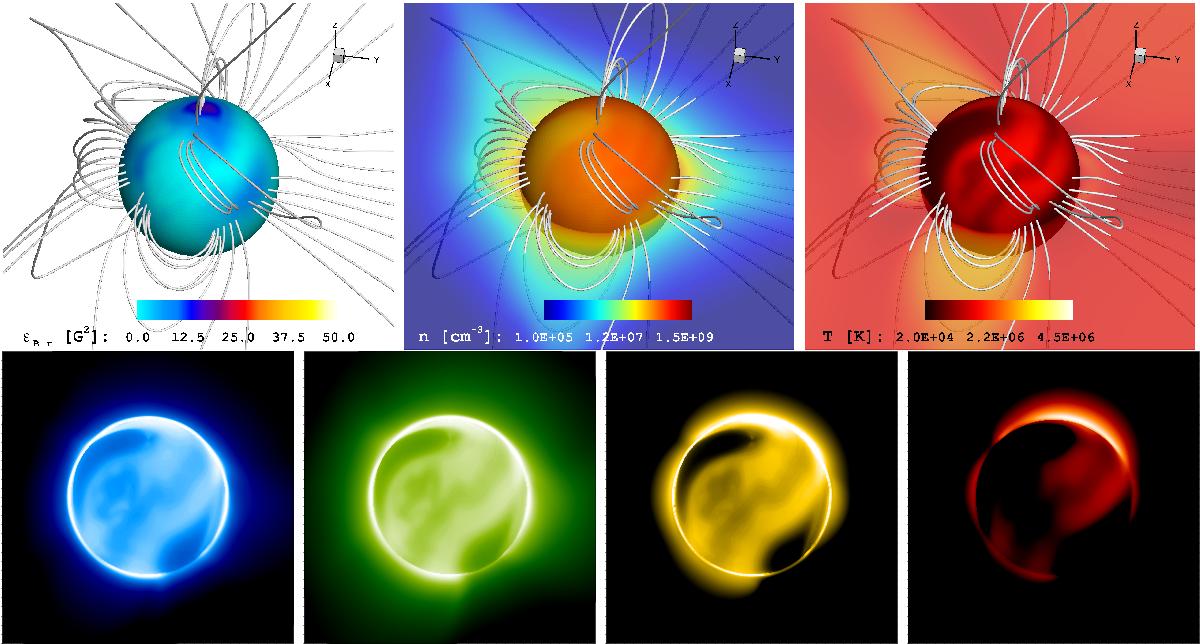
Simulation results for the coronal structure of HD 22049 driven by the ZDI large-scale magnetic field map. The upper panels contain the distribution of the magnetic energy density (εB r, left), the number density (n, middle), and temperature (T, right). For the last two quantities the distribution over the equatorial plane (z = 0) is presented. The sphere represents the stellar surface and selected 3D magnetic field lines are shown in white. The lower images correspond to synthetic coronal emission maps in EUV (blue/171 Å, green/195 Å and yellow/284 Å) and SXR (red/2−30 Å). The perspective and colour scales are preserved in all panels, with an inclination angle of i = 45°.


Current usage metrics show cumulative count of Article Views (full-text article views including HTML views, PDF and ePub downloads, according to the available data) and Abstracts Views on Vision4Press platform.
Data correspond to usage on the plateform after 2015. The current usage metrics is available 48-96 hours after online publication and is updated daily on week days.
Initial download of the metrics may take a while.