Free Access
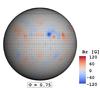
Fig. 4
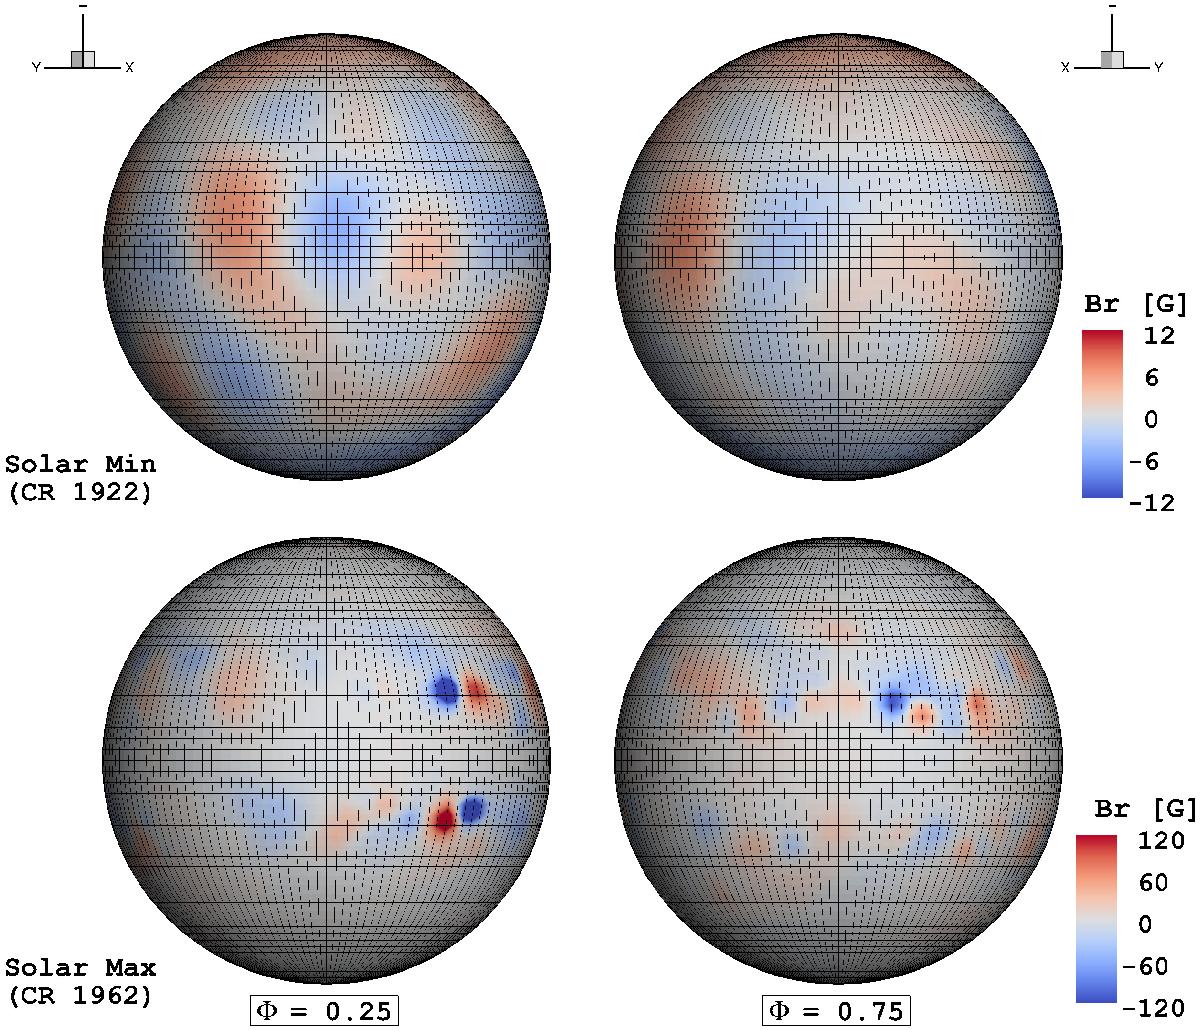
Surface radial magnetic field maps of the Sun during activity minimum (CR 1922, top) and maximum (CR 1962, bottom) taken by SOHO/MDI. Note the difference in the magnetic field range for each case. An inclination angle i = 90° is used for the visualisations.
This figure is made of several images, please see below:
Current usage metrics show cumulative count of Article Views (full-text article views including HTML views, PDF and ePub downloads, according to the available data) and Abstracts Views on Vision4Press platform.
Data correspond to usage on the plateform after 2015. The current usage metrics is available 48-96 hours after online publication and is updated daily on week days.
Initial download of the metrics may take a while.