Fig. 11
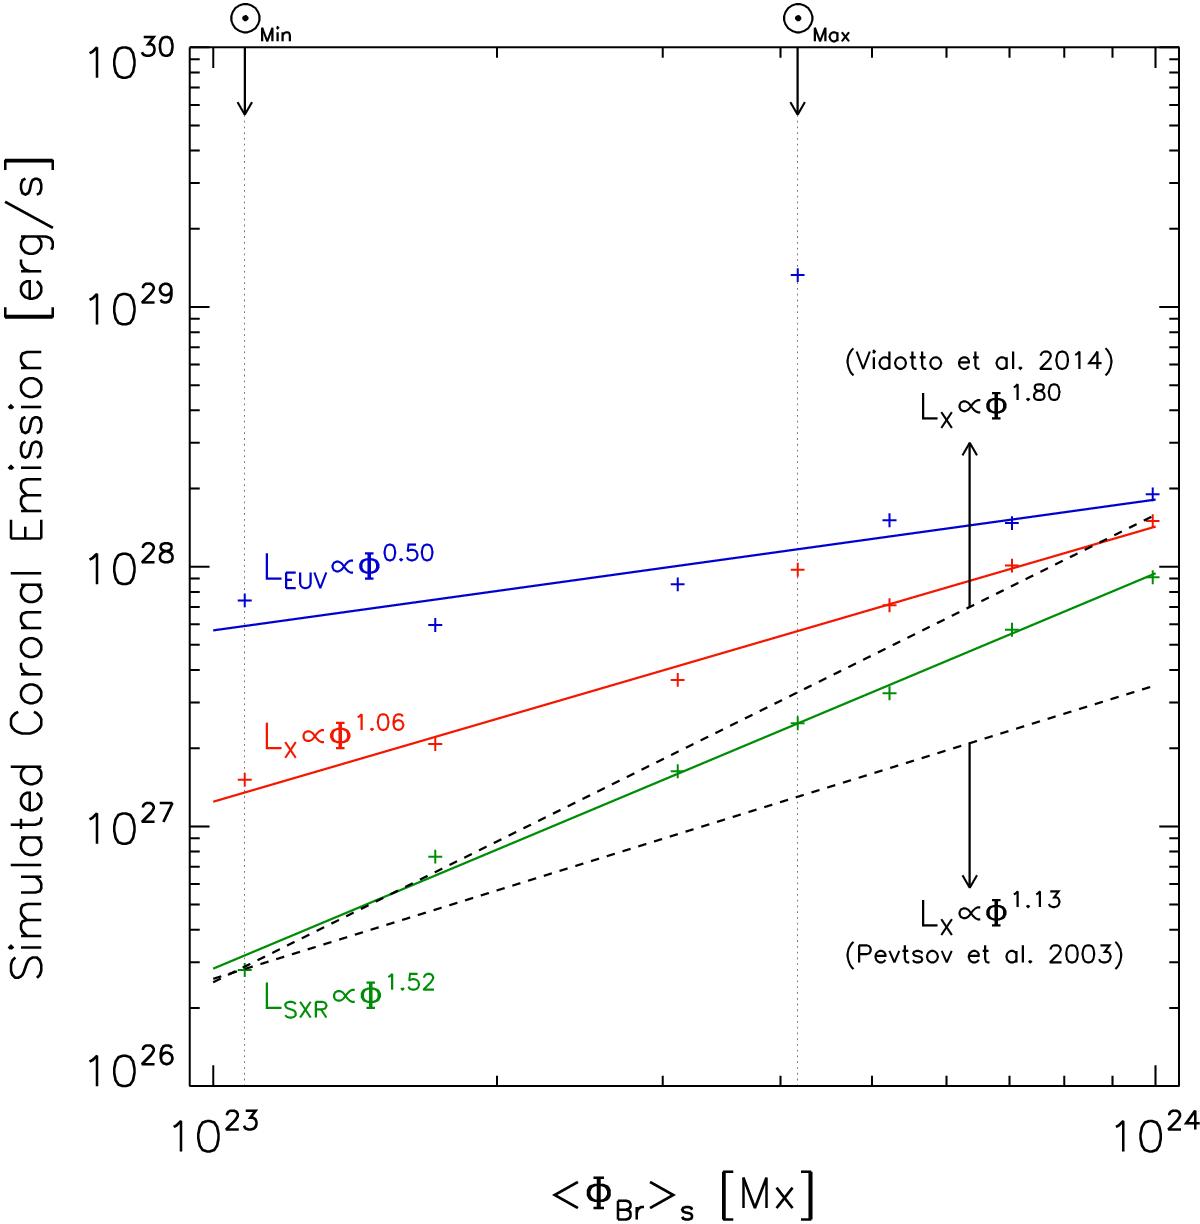
Simulated high-energy coronal emission vs. unsigned radial magnetic flux ⟨ΦBr⟩s. Each point corresponds to one of the simulations described in Sect. 4, including the solar cases as indicated. These values are calculated from synthetic spectra, based on the EM(T) distributions (Sect. 5.1), and integrated in the SXR (2−30 Å, green), X-ray (5−100 Å, red) and EUV (100−920 Å, blue) bands. The solid lines correspond to fits to the simulated data points. The dashed lines are based on observational studies using X-ray, against magnetic field measurements using ZB (Pevtsov et al. 2003) and ZDI (Vidotto et al. 2014).
Current usage metrics show cumulative count of Article Views (full-text article views including HTML views, PDF and ePub downloads, according to the available data) and Abstracts Views on Vision4Press platform.
Data correspond to usage on the plateform after 2015. The current usage metrics is available 48-96 hours after online publication and is updated daily on week days.
Initial download of the metrics may take a while.