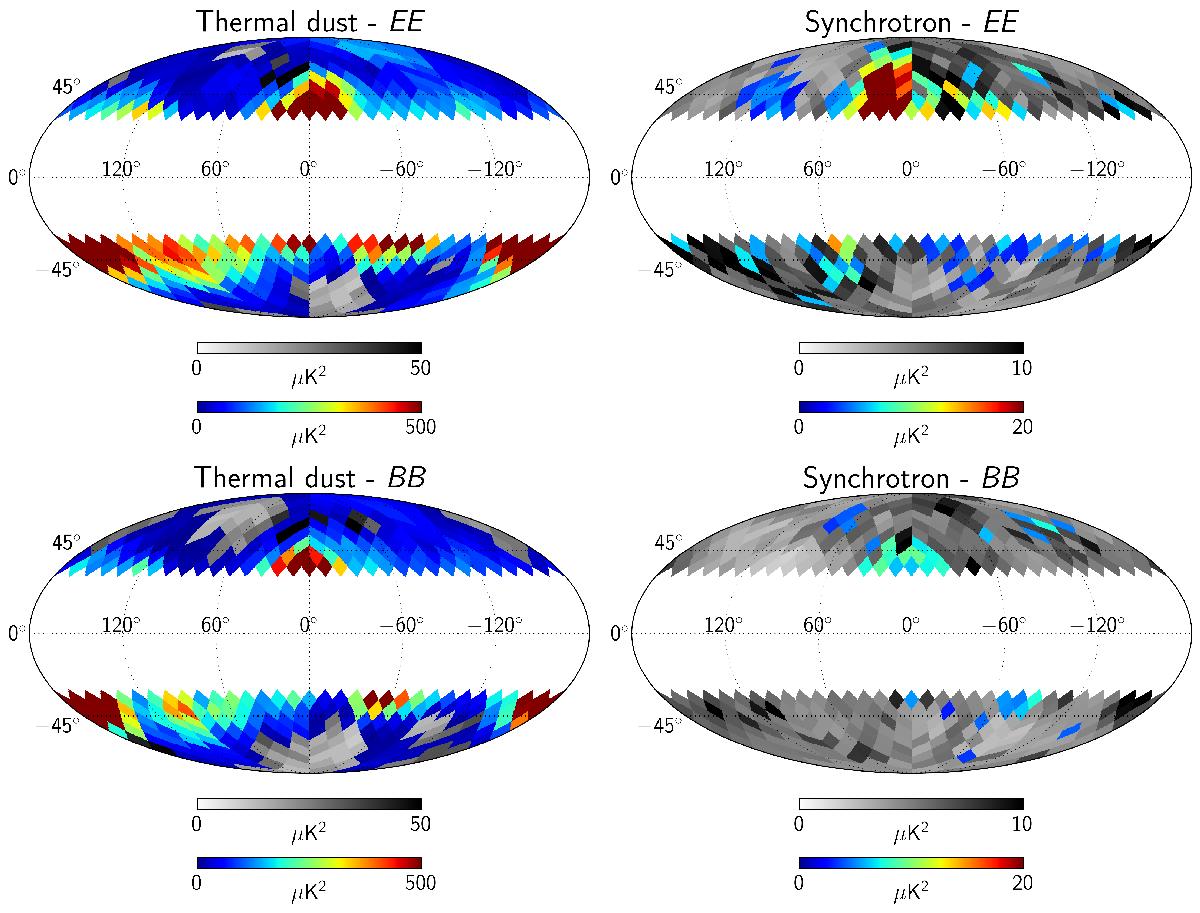
Fig. 3

E (top) and B modes (bottom) power spectra measurements in the ℓ80 multipole bin for dust in the Planck 353 GHz channel (left) and synchrotron (right) via cross-correlation of the LFI 30 GHz and WMAP-K-band. Colored pixels report detection above 3σ. Gray pixels show upper limits where no detection was possible above the threshold, as defined in Eq. (2).
Current usage metrics show cumulative count of Article Views (full-text article views including HTML views, PDF and ePub downloads, according to the available data) and Abstracts Views on Vision4Press platform.
Data correspond to usage on the plateform after 2015. The current usage metrics is available 48-96 hours after online publication and is updated daily on week days.
Initial download of the metrics may take a while.


