Fig. 2
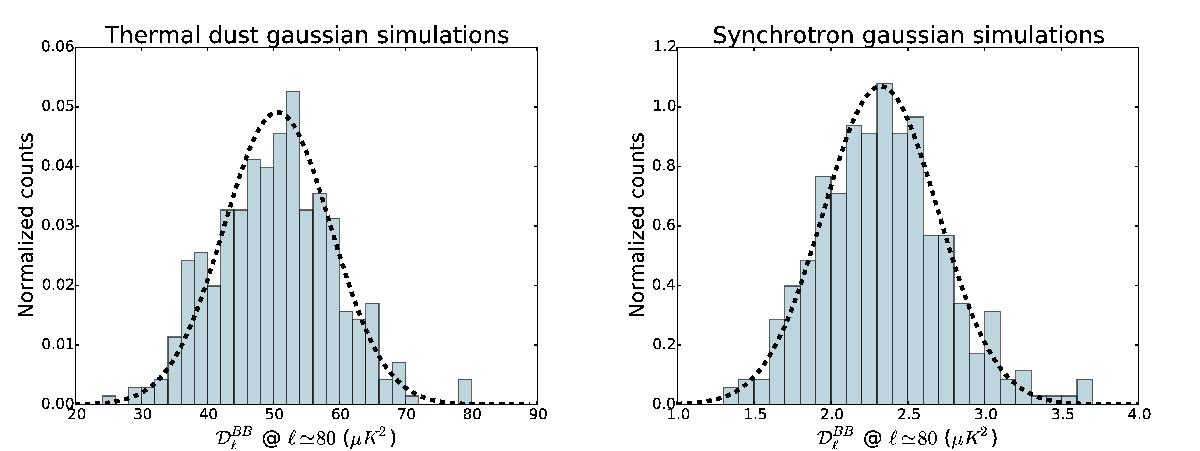
Validation of the Xpure power spectrum estimator for thermal dust (left panel) and synchrotron (right panel) Gaussian simulations. Gray histograms are obtained from the B-mode power spectra estimation of the input simulated maps in the multipole bin centered at ℓ ≃ 80 in the 352 considered sky regions. Black curves represent the expected Gaussian distribution centered on the mean value of the input spectra from which simulated maps are computed, and with variance defined as in Eq. (1).
Current usage metrics show cumulative count of Article Views (full-text article views including HTML views, PDF and ePub downloads, according to the available data) and Abstracts Views on Vision4Press platform.
Data correspond to usage on the plateform after 2015. The current usage metrics is available 48-96 hours after online publication and is updated daily on week days.
Initial download of the metrics may take a while.