| Issue |
A&A
Volume 588, April 2016
|
|
|---|---|---|
| Article Number | A92 | |
| Number of page(s) | 14 | |
| Section | Interstellar and circumstellar matter | |
| DOI | https://doi.org/10.1051/0004-6361/201527667 | |
| Published online | 23 March 2016 | |
Herschel observations of the nebula M1-67 around the Wolf-Rayet star WR 124⋆,⋆⋆
1
Institut d’Astrophysique et de Géophysique, Université de Liège,
Quartier Agora, Allée du 6 août,
19C−Bât. B5c, 4000
Liège ( Sart-Tilman), Belgium
e-mail:
This email address is being protected from spambots. You need JavaScript enabled to view it.
2
Instituut voor Sterrenkunde, KU Leuven, Celestijnenlaan 200D, Bus
2401, 3001
Leuven,
Belgium
3
Koninklijke Sterrenwacht van België, Ringlaan 3,
1180
Brussels,
Belgium
4
Department of Physics and Astronomy, University College
London, Gower
Street, London
WC1E 6BT,
UK
Received: 30 October 2015
Accepted: 29 January 2016
Abstract
Infrared Herschel imaging and spectroscopic observations of the nebula M1-67 around the Wolf-Rayet star WR 124 have been obtained along with optical imaging observations. The infrared images reveal a clumpy dusty nebula that extends up to 1 pc. The comparison with the optical images shows that the ionized gas nebula coincides with the dust nebula, the dust and the gas being mixed together. A photodissociation region is revealed from the infrared spectroscopic analysis. The analysis of the infrared spectrum of the nebula, where forbidden emission lines of ionized elements were detected, showed that the nebula consists of mildly processed material with the calculated abundance number ratios being N/O = 1.0 ± 0.5 and C/O = 0.46 ± 0.27. Based on a radiative transfer model, the dust mass of the nebula was estimated to be 0.22 M⊙ with a population of large grains being necessary to reproduce the observations. The comparison of the mass-loss rate and the abundance ratios to theoretical models of stellar evolution led to the conclusion that the nebular ejection took place during a RSG/YSG evolutionary phase of a central star with an initial mass of 32 M⊙.
Key words: circumstellar matter / stars: massive / stars: mass-loss / stars: Wolf-Rayet / stars: individual: WR 124
Herschel is an ESA space observatory with science instruments provided by European-led Principal Investigator consortia and with important participation from NASA.
Based in part on observations collected at the European Southern Observatory, La Silla, Chile.
Senior Research Associate FNRS.
© ESO, 2016
1. Introduction
Wolf-Rayet (WR) stars represent an intermediate phase in the late evolution of O-type massive stars with an initial mass ≥30 M⊙ (Maeder & Meynet 2010). The star loses a significant fraction of its mass through the stellar wind and/or through episodes of extreme mass loss during a red supergiant (RSG) or luminous blue variable (LBV) evolutionary phase so that the outer layers are removed, leaving a bare core that becomes a WR. If the WR is in a close binary system the lower limit for the initial mass is not as robust (Crowther 2007), and in this case the H-rich envelope is lost through a Roche lobe overflow. WR stars are characterized by strong broad emission lines in the optical region due to stellar winds. They are divided into two groups: the WN subtypes that show strong lines of He and N and the WC and WO subtypes that show strong He, C, and O in their spectra (Crowther 2007).
One third of the galactic WR stars are observed to have an associated nebula at optical wavelengths (Marston 1997). Various morphologies have been observed around Galactic WR stars (Chu et al. 1983) and WR stars in the Magellanic Clouds (Dopita et al. 1994). The ring nebulae around WR stars are thought to contain material that has been ejected in a previous evolutionary phase of the star, a LBV or a RSG phase (Crowther 2007). Besides this, ejected nebula have been observed around LBV stars (Hutsemékers 1994; Nota et al. 1995b). Consequently, the study of the nebulae around WR stars and in general around evolved massive stars is crucial for understanding the evolution of these stars, in particular, through the study of their mass-loss history.
The nebula M1-67 surrounds the Galactic star WR 124 (209 BAC, also known as Merrill’s star), which has a WN 8 spectral type (Smith & Aller 1973). It was discovered by Minkowski (1946), who suggested that it might be a planetary nebula (PN). Then, Sharpless (1959) classified it as an H ii region. Merrill (1938) measured a high heliocentric velocity of + 200 km s-1 for WR 124 that was confirmed by Bertola (1964). The nebula M1-67 was later found to have a similar heliocentric velocity (Perek & Kohoutek 1967; Cohen & Barlow 1975; Pismis & Recillas-Cruz 1979). It was first suggested to be a WR ring nebula in the study of Cohen & Barlow (1975) based on infrared observations.
Based on the analysis of high-resolution spectra of the nebula M1-67, Solf & Carsenty (1982) argued that the nebular material originates in the central WR star. This material may have been lost in an earlier evolutionary stage of the central star and swept up by the strong stellar wind. The study of Esteban et al. (1991) confirmed the stellar origin of the nebular material. They drew this conclusion based on the abundances of N (enhanced by a factor of 4-7.5), O (depleted by a factor of 5-7.5) and S (normal H ii region abundance), and concluded that M1-67 is a WR ring nebula. Though the nebula is spatially non-uniform and has a clumpy appearance with knots of emission, they also found that there is a homogeneity in excitation conditions throughout the nebula, since the knots have similar spectra.
Analyzing optical coronagraphic data, Nota et al. (1995a) reported observing an axisymmetrical expansion in M1-67 for the first time. Sirianni et al. (1998) performed similar observations with higher resolution. Their radial velocity data revealed two different motions in the circumstellar environment of WR 124: the expansion of a spherical shell and a bipolar outflow that both may have been formed during the post-main sequence evolution of the central star when it was a LBV. Deep Hubble Space Telescope (HST) imaging (Grosdidier et al. 1998) revealed details of the fragmentation of the nebula, which appeared composed of filamentary structures that extend around the central star and many, mostly unresolved, clumps. These data showed no clear evidence of a bipolar or axisymmetrical structure. The authors argued that M1-67 could be the result of a clumpy wind during the LBV evolutionary phase of the central star.
Van der Sluys & Lamers (2003) studied the dynamics of the M1-67 nebula. They show that it interacts with the interstellar medium so that a parabolic-like bow shock is formed. Because the star is moving away from us with a velocity of about 180 km s-1, we see the hollow bow shock from behind (see also Solf & Carsenty 1982). They conclude that the M1-67 nebula is due to multiple outbursts during a previous LBV phase of the central star flowing along the bow-shock surface. Cichowolski et al. (2008) analyzed high resolution radio data of the circumstellar environment of WR 124. They reporte the presence of two large H i cavities that are parts of the same bow shock structure. The radio morphology of the nebula at 8.5 GHz is very similar to the optical one. Based on integral field spectroscopic data and considering theoretical evolutionary models, Fernández-Martín et al. (2013) propose that the central star has recently entered the WR phase and that the nebula is essentially composed of material that was ejected during a LBV phase of the star.
Concerning the distance to M1-67, several studies tried to determine it, but given the peculiar velocity of the nebula, they had to assume the nature of the central star and its nebula. Cohen & Barlow (1975) calculated a distance of 4.33 kpc, arguing that the central star is a Population I WN8 star and using the absolute magnitude calibration of Smith (1973), a value consistent with the observed extinction. Pismis & Recillas-Cruz (1979) estimated a distance of about 4.5 kpc, also assuming a Population I WR star of spectral type WN8 but using a different and more recent absolute magnitude calibration. Later on, Crawford & Barlow (1991) analyzed the interstellar Na I D2 absorption spectrum of the star and found a distance of 4−5 kpc that excluded a PN nature. Recently, Marchenko et al. (2010) have calculated a geometric distance of 3.35 kpc with an estimated uncertainty of 20%, based on two-epoch imaging data that provide an expansion parallax. Since this latest distance calculation is assumption-free as stressed by the authors, we adopt it for our study, along with the properties of the star and the wind that were derived based on it in Marchenko et al. (2010).
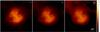 |
Fig. 1 PACS images of the nebula M1-67 at 70 μm, 100 μm, and 160 μm, from left to right. The size of each image is 4′× 4′. The scale on the right corresponds to the surface brightness (arbitrary units) and is logarithmic to better show the faint emission. The white circles in the upper right corner of each image represent the PSF size. North is up and east to the left. |
In the present paper we analyze and discuss the infrared images and the spectrum of the nebula M1-67 taken with the Photodetector Array Camera and Spectrometer (PACS, Poglitsch et al. 2010), and Spectral and Photometric Imaging Receiver (SPIRE, Griffin et al. 2010) instruments onboard the Herschel Space Observatory (Pilbratt et al. 2010). We present these observations and the data reduction procedure in Sect. 2. Using these observations, we then describe the nebular morphology in Sect. 3. In Sect. 4 we perform the dust continuum emission model, while the analysis of the emission line spectrum follows in Sect. 5. In Sect. 6 a general discussion is presented and finally in Sect. 7 the conclusions of this work are given.
2. Observations and data reduction
2.1. Infrared observations
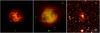 |
Fig. 2 Left: view of the optical Hα+[Nii] emission from the nebula M1-67. Center: contour image of the Hα+[Nii] emission from the nebula (green lines) superposed on the PACS infrared image of the nebula at 70 μm (shown also in Fig. 1 at the same scale). Right: view of the nebula in the continuum filter. This continuum image has been subtracted from the image obtained in the Hα+[Nii] filter to create the image seen in the leftmost panel and to emphasize the ionized gas emission. The size of each image is 4′× 4′ and the scale is logarithmic to better show the faint emission. North is up and east to the left. |
The infrared observations of the M1-67 nebula were carried out in the framework of the Mass-loss of Evolved StarS guaranteed time key program (MESS; Groenewegen et al. 2011), including PACS and SPIRE imaging and PACS spectroscopy.
The PACS imaging observations were carried out on April 8, 2010, which corresponds to Herschel’s observational day (OD) 329. The scan map observing mode was used, in which the telescope slews at constant speed (20′′/s) along parallel lines so as to cover the required area of the sky. Two orthogonal scan maps were obtained for each filter and finally our data set consists of maps at 70, 100, and 160 μm. The observation identification numbers (obsID)s of the four scans are 1342194080, 1342194081, 1342194082, and 1342194083 with a duration of 2622 s each. The Herschel interactive processing environment (HIPE) package (Ott 2010) was used for the data reduction up to level 1. Subsequently, the Scanamorphos software (Roussel 2013) was used to further reduce and combine the data. In the final maps, the pixel size is 2″ in the blue (70, 100 μm) channel and 3″ in the red (160 μm) channel. The Herschel-PACS point-spread function (PSF) full widths at half maximum (FWHMs) are 5 2, 77, and 12″ at 70 μm, 100 μm, and 160 μm, respectively.
The SPIRE imaging observations were carried out on September 21, 2010 (OD 495). The large map observing mode was used. In this mode the telescope slews at constant speed (nominal speed: 30′′/ s) along parallel lines so as to scan the required sky area. The cross scan pointing mode was selected so as to obtain two orthogonal scans during a single observation. Our dataset consists of maps at 250, 350, and 500 μm. The obsID is 1342204949 with a duration of 911 s. The data were retrieved from the archive, processed up to level 2. The surface brightness of the three maps was transformed from Jy/sr to Jy/pixel with the help of HIPE. The pixel size is 6″, 10″, and 14″ at 250 μm, 350 μm, and 500 μm, respectively. The SPIRE PSF FWHMs are 18″, 25″ and 37″ at 250 μm, 350 μm, and 500 μm, respectively.
The PACS spectroscopic observations of the M1-67 nebula were carried out on May 4, 2011 (OD 720). The PACS integral-field spectrometer covers the wavelength range from 52 μm to 220 μm in two channels that operate simultaneously in the blue band, 52−98 μm, and the red band, 102−220 μm with a resolving power of λ/δλ ~ 940−5500 depending on the wavelength. Simultaneous imaging of a 47″ × 47″ field of view is provided, resolved in 5 × 5 square spatial pixels (i.e., spaxels). Then, the two-dimensional field-of-view is rearranged via an image slicer along a 1 × 25 pixels entrance slit for the grating. The chopped line scan observing mode was used for these observations. In this mode, instead of having a complete coverage between 52 μm and 220 μm, the observations are done in specific, previously chosen, short wavebands where it is possible to detect a nebular emission line. The background spectrum was obtained through chopping and nodding. The two obsIDs are 1342220598 and 1342220599. For the spectroscopic data reduction we followed the standard steps using HIPE.
2.2. Visible observations
The optical images of the M1-67 nebulae were obtained on April 6, 1995, with the 3.6-m telescope at the ESO, La Silla, Chile. A series of short (1−10 s) and long (30−60 s) exposures were secured in a Hα+[N ii] filter (λc = 6560.5 Å; FWHM = 62.2 Å) and in a continuum filter just redwards (λc = 6644.7 Å; FWHM = 61.0 Å). The frames were bias-corrected and flat-fielded. The night was photometric and the seeing around 12. The CCD pixel size was 0605 on the sky. To properly calibrate the images, three spectrophotometric standard stars and three PN with known Hα flux were observed.
3. Morphology of the nebula M1-67
The PACS images of the nebula M1-67 around the WR 124 star in the three infrared filters, 70 μm, 100 μm, and 160 μm, are shown in Fig. 11. The optical Hα+[N ii] image of the nebula M1-67 is illustrated in Fig. 2. To emphasize the Hα+[N ii] ionized gas emission, the redward continuum image has been subtracted, after correcting for the position offsets and for the different filter transmissions, using field stars. It should be mentioned that the nebula is clearly detected in the λ 6644.7 Å continuum filter (right panel of Fig. 2), indicating significant dust scattering. In the central panel of Fig. 2, the contour image of the Hα+[N ii] emission is illustrated, superimposed on the infrared image of the nebula at 70 μm. A three color image of the nebula M1-67 and its environment is shown in Fig. 3.
The infrared images reveal a dust nebula with a non-uniform brightness that has a complex morphology. It appears to be clumpy but the clumps are not resolved in these observations. Although the brightest parts of the nebula appear distributed along an elongated structure, it is difficult to infer from the infrared images that the nebula is bipolar as suggested by Fernández-Martín et al. (2013). Moreover, a fainter structure, with a roughly spherical shape, seems to surround the bright nebulosities. This faint spherical structure was also observed in the Spitzer MIPS 24 μm image (Gvaramadze et al. 2010) discussed in Fernández-Martín et al. (2013). The global infrared morphology of M1-67 therefore seems to be essentially spherical, although strongly inhomogeneous, with an average radius of about 60″ that corresponds to 1 pc at the adopted distance of 3.35 kpc. The nebula seems to be located inside an empty cavity (Fig. 3) that may have formed in a previous evolutionary phase of the central star.
The Hα+[N ii] view of the nebula is very similar to the infrared one. Its general morphology is the same, but with more details because the optical images have a higher resolution (Fig. 2). The dust nebula extends slightly further out the gas nebula. The ionized gas nebula is clumpy with a very complex structure of filaments. The contour image of the optical emission superimposed on the 70 μm image shows that the brightest regions (clumps) of the ionized gas nebula coincide with the bright regions of the dust nebula. An average angular radius of ~55″, which corresponds to 0.9 pc at a distance of 3.35 kpc, can be defined for the ionized gas nebula, in agreement with the measurements of Grosdidier et al. (1998). Solf & Carsenty (1982) and Sirianni et al. (1998) had measured a smaller radius of about 45″ without detecting the faint outer component. The similarity between the optical and the infrared view implies that the gas is mixed with the dust in the nebula M1-67.
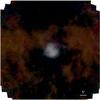 |
Fig. 3 Three-color (70 μm in blue, 100 μm in green, and 160 μm in red) image of the nebula M1-67. The nebula appears located inside a cavity in the interstellar medium. The scale is logarithmic for all three colors. The size of the image is 15′× 15′. North is up and east to the left. |
4. Dust continuum emission
By performing aperture photometry on the PACS and SPIRE images, we derived integrated flux densities for the nebula M1-67. Data from the archive of the Infrared Astronomical Satellite (IRAS) mission (Neugebauer et al. 1984) were also used to extend the spectral energy distribution (SED) to shorter wavelengths. To all the flux densities derived from these data, we applied photometric color corrections in order to make the conversion of the monochromatic flux densities, which refer to a constant energy spectrum, to the true object flux densities at the photometric reference wavelengths of each instrument.
For the IRAS data, the flux density ratios were used to derive the color temperature, and the corresponding correction factor was used to correct the flux densities (Beichman et al. 1988). The ratio R (12, 25) corresponds to a temperature of 140 K, while the ratios R (25, 60) and R (60, 100) correspond to a temperature of 100 K. Consequently, we decided to calculate the correction for the flux densities at 12 μm and 25 μm using both temperatures and then to consider the average of the two corrected flux densities at each wavelength, counting the difference between them in the error. The flux densities at 60 μm and 100 μm were corrected using the correction factors that correspond to a temperature of 100 K. For the Herschel-PACS data color correction, we fit a black body (BB), also using the 25 μm IRAS observation to have a data point before the maximum of the BB curve. The color correction factors that correspond to a temperature of 100 K derived from this fit were then used to correct the flux densities (Müller et al. 2011). For the Herschel-SPIRE data color correction, we followed the instructions given in SPIRE Handbook2.
Table 1 presents the color-corrected flux density measurements from IRAS and Herschel space missions. These data are used to construct the infrared SED of the nebula M1-67 shown in Fig. 4.
Color-corrected flux densities of the nebula M1-67.
To model the dust nebula around WR 124 and calculate the temperature and the mass of the dust we used the 2-Dust code (Ueta & Meixner 2003), a publicly available two-dimensional radiative transfer code that can be supplied with complex axisymmetric density distributions as well as with various dust grain density distributions and optical properties. The photometric data of Table 1 are used for fitting the dust model.
The first step for the dust modeling is to constrain the nebular geometry revealed through the optical and the infrared images. As mentioned in Sect. 1, according to previous studies there are two different scenarios for the nebula M1-67: a) a bipolar morphology that was suggested by Sirianni et al. (1998), firstly reported by Nota et al. (1995a), but that was not confirmed by Grosdidier et al. (1998, 2001); and b) a bow shock model that was suggested by Van der Sluys & Lamers (2003) after a detailed analysis of radial velocities, firstly mentioned by Solf & Carsenty (1982) and later by Grosdidier et al. (1999), and that was confirmed by Cichowolski et al. (2008) and Marchenko et al. (2010) (see Solf & Carsenty 1982 for a sketch).
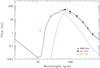 |
Fig. 4 Infrared SED of the nebula M1-67 around the Wolf-Rayet star WR 124 from color-corrected photometric measurements from IRAS and Herschel (PACS and SPIRE) space missions. The best result of the 2-Dust model fitting is illustrated (solid line). It was achieved by considering two populations of dust grains (dashed lines), a population of small grains with radii from 0.005 to 0.1μm, responsible for the emission at λ< 40 μm and a population of large grains with radii from 2 to 10μm, responsible for the infrared SED at λ> 70 μm. Data at λ< 20 μm are not considered in the fit. |
The bow shock scenario is the most plausible because the nebula M1-67 surrounds a massive runaway star that moves with a velocity that is much higher than the velocity of the interstellar medium (Solf & Carsenty 1982; Van der Sluys & Lamers 2003). Also, the optical and infrared view of the nebula does not show evidence for a clear bipolar morphology (Sect. 3). In this case, the standoff distance of the bow shock, ds, is about 0.65 pc using the parameters given in Marchenko et al. (2010) and the stellar velocity of 200 km s-1 determined by Cichowolski et al. (2008). This distance is equivalent to 40″ at 3.35 kpc. It is smaller than the measured radius of the nebula in the infrared, which is 60″ or 1 pc (Sect. 3), so the star is decentered with respect to the nebula but not much. Consequently, to model the dust, we make the approximation that the nebula is spherical with rin = 40″ and rout = 60″.
For the parameters of the central star WR 124 we adopted the distance D = 3.4 kpc, the luminosity log L/L⊙ = 5.18, and the temperature Teff = 35 800 K, which were estimated by Marchenko et al. (2010). We considered two populations of dust grains that have same composition but different sizes, because the infrared SED of M1-67 (Fig. 4) is too broad to be reproduced with only one population as was the case for the nebula around the LBV AG Car (Vamvatira-Nakou et al. 2015). For each of the two populations of dust grains, we assumed the size distribution of Mathis et al. (1977): n(α) ∝ α-3.5 with αmin<α<αmax, α being the grain radius. By varying αmin (or αmax) and the opacity, we can adjust the model to the data. As in Vamvatira-Nakou et al. (2013, 2015), the fit is done for data points at λ> 20 μm.
The best fit (Fig. 4) was achieved using the following populations of dust grains and the optical constants of olivines with a 50/50 Fe to Mg abundance given by Dorschner et al. (1995), extrapolated to a constant refraction index in the far-ultraviolet (FUV). The first is a population of small grains with radii from 0.005 to 0.1μm, which is responsible for the emission at λ< 40 μm. The second is a population of large grains with radii from 2 to 10 μm, which is responsible for the infrared SED at λ> 70 μm. Such large grains were also found in our analysis of the AG Car nebula (Vamvatira-Nakou et al. 2015).
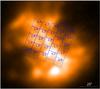 |
Fig. 5 Footprint of the PACS spectral field-of-view on the image of the nebula M1-67 at 70 μm. This field is composed of 5 × 5 spaxels, each one of them labeled with a number pair. North is up and east is to the left. |
According to the model results, the total mass of dust is Mdust ~ 0.22 M⊙ (0.006 M⊙ from the small dust grains and 0.21 M⊙ from the large dust grains). The uncertainty of ~20% accounts for the dispersion of the mass values obtained with different models, for example, models that have different grain composition. The temperature of small grains goes from 65 K at rin to 58 K at rout, while the temperatures of large grains goes from 29 K at rin to 26 K at rout. Cichowolski et al. (2008) found a dust temperature of 70 K for silicates. There is a difference between these results and ours because we considered two populations of dust grains.
5. Emission line spectrum
Figure 5 illustrates the footprint of the PACS spectral field of view, which is composed of 25 (5 × 5) spaxels, on the image of the M1-67 nebula at 70 μm. This footprint is not a perfect square, because one column of spaxels is offset from the others. Each spaxel corresponds to a different part of the nebula, and we have a spectrum for each one of them. Nevertheless, a big part of the nebula is outside of the spectral field-of-view, which is not large enough to cover the entire nebula.
The integrated spectrum of the nebula over the 25 spaxels is shown in Figs. 6 and 7, recalling that the spectroscopic observational mode provides us only with some preselected areas of the PACS waveband and not a complete coverage. The forbidden emission lines that have been detected are the following: [O i]λλ 63, 146 μm, [N ii]λλ 122, 205 μm, [C ii]λ 158 μm, [N iii]λ 57 μm, and [O iii]λ 88 μm.
5.1. Line flux measurements
To measure the emission line intensities in each one of the 25 spectra we performed a Gaussian fit to the line profiles using the Image Reduction and Analysis Facility (IRAF) package (Tody 1986, 1993). These measurements are presented in the Table A.1. Not all the lines are detected in each spaxel. The [O i] 146 μm line seems to be the most difficult to detect. In contrast, the [N ii] 122 μm line, detected everywhere, has the highest flux among the detected lines in every spaxel.
To increase the signal-to-noise ratio (S/N), we then measured the flux of the emission lines that are present on the spectrum summed over the 25 spaxels (Figs. 6 and 7). We note that the [N iii] 57 μm and [O iii] 88 μm lines are only detected in the summed spectrum. The [N ii] 205 μm line is known to have a problematic calibration in PACS. As a result, we need to correct its flux before using it in the following analysis. Using objects from the MESS collaboration (Groenewegen et al. 2011) that were observed with both PACS and SPIRE, we calculated a correction factor. With the help of the SPIRE/PACS cross calibration, we then found that the measured [N ii] 205 μm flux should be multiplied by a correction factor of 4.2, assuming an error of 25% for the final corrected [N ii] 205 μm flux3.
The emission line flux measurements from the spectrum summed over the 25 spaxels are given in Table 2, taking the correction on the [N ii] 205 μm line flux into account. There is good agreement between these results and the flux measurements of the lines [N ii]λ 122 μm and [C ii]λ 158 μm that are detected in the ISO-LWS spectrum of M1-67 (see Appendix B). Considering that the circular aperture of this instrument is 80′′ so that most of the bright nebula is inside, we can conclude that most of the nebular flux is measured when using the PACS spectrum summed over the 25 spaxels.
Line fluxes from the summed spectrum (25 spaxels) of the nebula M1-67.
In the following spectral analysis, we only use ratios of the line fluxes from the spectrum summed over the 25 spaxels to determine nebular properties, assuming that they represent the whole nebula. We do not use the line fluxes themselves because they only come from a part of the nebula that corresponds to the area covered by the 25 spaxels.
5.2. Photoionization region characteristics
The following four detected emission lines: [N ii] 122, 205 μm, [N iii] 67 μm, and [O iii] 88 μm are associated to the photoionization region (i.e., H ii region) of the M1-67 nebula. The other forbidden emission lines, detected in the nebular spectrum, originate in a region of transition between ionized and neutral hydrogen. They may indicate the presence of a photodissociation region (PDR), which we analyze and discuss in the next section.
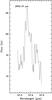 |
Fig. 6 Integrated PACS spectrum of the nebula M1-67 around the WR 124 star over the 25 spaxels. The forbidden emission line [N iii] 57 μm is detected. |
5.2.1. Hα flux
To estimate the Hα+[N ii] flux from the M1-67 nebula we integrated the surface brightness over the whole nebula. We corrected for the contamination by field stars and the background and we extrapolated the emission from the occulted central part using the mean surface brightness. We measured the continuum flux from the reflection nebula in the adjacent filter, accounting for the difference in filter transmissions. Since WR 124 is a strong emission-line star, the reflected stellar Hα flux must also be subtracted. The final contamination due to the reflection nebula was estimated to be 13%, considering the Hα equivalent widths measured by Hamann et al. (1993) for WR 124 in 1992 (i.e., accounting for ~3 years of time delay). We subtracted the contribution of the strong [N ii] lines using the [N ii] /Hα ratios from available spectroscopic data and from the transmission curve of the Hα+[N ii] filter. With the help of the three PN and the three spectrophotometric standard stars observed in the same filter, we did the conversion to absolute flux. The conversion factors derived from all these six objects are in excellent internal agreement.
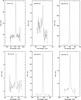 |
Fig. 7 Integrated PACS spectra of the nebula M1-67 around the WR 124 star over the 25 spaxels. The detected forbidden emission lines are [O i] 63 μm, [O iii] 88 μm, [N ii] 122 μm, [O i] 146 μm, [C ii] 158 μm, and [N ii] 205 μm. |
The Hα flux was measured to be F(Hα) = 2.4 × 10⁻¹¹ erg cm-2 s-1 uncorrected for reddening and with an uncertainty of ~20%. Adopting E(B − V) = 0.93 ± 0.10 (Esteban et al. 1991), we derived F0(Hα) = (2.0 ± 0.6) × 10-10 erg cm-2 s-1 for the M1-67 nebula. Within the uncertainties, this flux agrees with the flux measured by Grosdidier et al. (1998): F0(Hα) = 2.3 × 10⁻¹⁰ erg cm-2 s-1 using the same reddening. The flux density from the reflection nebula is Fλ = 2.9 × 10⁻¹⁴ erg cm-2 s-1 Å-1 at 6650 Å (the central wavelength of the continuum filter).
The Esteban et al. (1991) reddening estimate was based on long-slit Balmer line spectral ratios. The wavelength baseline used is small, and considering how dusty this nebula is, there may well be significant reddening variations across the nebula. Given that there is a good S/N 8.64 GHz radio flux of 205 ± 10 mJy from Cichowolski et al. (2008), we can get a more accurate reddening-free Hα flux estimate from that flux using the radio-Balmer method of Milne & Aller (1975). Using the formulae given in Vamvatira-Nakou et al. (2013) that are based on Osterbrock & Ferland (2006) and Draine (2011), we can write 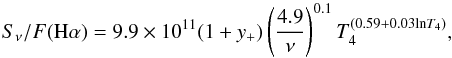 (1)where the radio flux, Sν, is in mJy; the Hα flux is in erg cm-2 s-1, y+ = nHe+/nH+, with nH+ = np, nHe+ being the number densities of the ionized hydrogen and ionized helium, respectively; the radio frequency, ν, is in GHz; and T4 = Te/ (104 K). Assuming an electron temperature, Te, equal to 7000 K (mean value of the estimate of Barker 1978 and Esteban et al. 1991) that we adopt for the following analysis as Fernández-Martín et al. (2013) with an uncertainty of 20% that is constant throughout the nebula, we have T4 = 0.7. The value of y+ = 0.013 is taken from Esteban et al. (1991). This gives an unreddened Hα flux of F0 = 2.7 × 10⁻¹⁰ erg cm-2 s-1 with an uncertainty of about 30%. This is the value we use for the following analysis.
5.2.2. Electron density
The [S ii] 6717/6731 ratio is an electron density diagnostic in the optical. Several electron density estimates were made based on this ratio. Solf & Carsenty (1982) calculated an electron density of 1000 ± 300 cm-3. Later on, Esteban et al. (1991) calculated the electron density in different parts of the nebula (four different slit positions). Their results for the central parts agree with the value of Solf & Carsenty (1982), while in the outer parts the electron density is about 200 cm-3. The results of Sirianni et al. (1998), who presented a detailed electron density distribution versus the distance from the star, confirmed the previous two studies. Fernández-Martín et al. (2013) calculated a density range from ~1500 cm-3, near the star, to ~650 cm-3 toward the nebular edge, results that are consistent with their electron density maps and the previous studies.
Grosdidier et al. (1998) estimated the electron density to be 825± 115 cm-3 based on the analysis of Hα observations of the nebula and adopting a distance of 4.5 kpc. Cichowolski et al. (2008) found a value of 630−360 cm-3 based on radio continuum data at 3.6 cm and adopting a distance of 5 kpc. Considering the uncertainties, these estimations agree with the previously mentioned ones that were based on the [S ii] 6717/6731 ratio.
The [N ii] 122/205 μm ratio is a diagnostic for the electron density of the nebula in the infrared waveband. Using the package nebular of the IRAF/STSDAS environment (Shaw & Dufour 1995), and considering the adopted electron temperature and the values given in Table 2, the electron density of the nebula M1-67 is estimated to be 600 ± 180 cm-3. The uncertainty was estimated and accounts for the measurement uncertainties and for the dispersion of values calculated using different electron temperatures within errors. Given the uncertainties, this estimate of the average nebular electron density agrees with the previous studies. Furthermore, when a nebula has a spatially inhomogeneous electron density, the use of different line ratios as density diagnostics lead to different results because of the difference in critical density between the lines used for the density calculation (Rubin 1989; Liu et al. 2001). This has been observed in PN (Liu et al. 2001; Tsamis et al. 2003) and in a LBV nebula (Vamvatira-Nakou et al. 2015).
Our estimate of the electron density based on infrared data will be used in the following calculations, because the best determination of the electron density is done when it is similar to the critical density of the lines used for the calculation (Rubin et al. 1994). Otherwise, the further calculation of ionic abundances will not give correct results (Rubin 1989; Liu et al. 2001).
It should be mentioned that the electron density was also calculated in each spaxel separately, in an effort to examine whether there are any spatial differences. Given the large uncertainties of the flux measurements, no significant spatial variation of the electron density was detected.
5.2.3. Ionizing flux
Using the estimated Hα flux, the rate of emission of hydrogen-ionizing photons, Q0, in photons s-1, and the radius of the Strömgren sphere, RS, in pc, can be estimated with the help of the following equations (Vamvatira-Nakou et al. 2013)
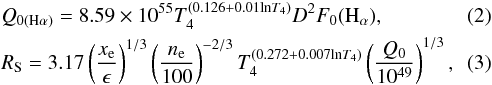 where xe = ne/np ≃ 1 + nHe+/nH+ = 1 + y+, assuming that the number density of the doubly ionized helium is nHe++ = 0, ϵ is the filling factor, D the distance of the nebula in kpc, and F0(Hα) the Hα flux in erg cm-2 s-1.
Assuming ϵ = 0.05, which is the value used by Grosdidier et al. (1998) and using the abundance ratio nHe+/nH+ = 0.013 from Esteban et al. (1991) and the adopted value for Te, we calculated a rate of emission of hydrogen-ionizing photons of about 2.7 × 1047 photons s-1 and a Strömgren radius of 0.8 pc. For a higher filling factor of 0.15 (Cichowolski et al. 2008), the Strömgren radius is 1.1 pc. Considering the uncertainties of the nebular parameters, our estimate for the Strömgren radius agrees with the value of 1.3 pc based on radio measurements (Cichowolski et al. 2008), given that they used a higher distance (5 kpc).
The ionized gas nebula extends up to about 0.9 pc from the central star (Sect. 3). This value is comparable, considering the uncertainties, to the estimated Strömgren radius that is the radius of an ionization bounded nebula by definition. Consequently, the nebula M1-67 around WR 124 may be ionization bounded.
5.2.4. Abundance ratio N/O
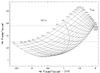 |
Fig. 8 Temperature-density PDR diagnostic diagram. The grid of flux ratios F[Oi] 63/F[Oi] 146 versus |
![Mathematical equation: \hbox{$F_{\rm[O{\textsc {i}}]63}/F_{\rm[C{\textsc {ii}}]158}^{\mathrm{PDR}}$}](/articles/aa/full_html/2016/04/aa27667-15/aa27667-15-eq126.png)
![Mathematical equation: \hbox{$F_{\rm[O{\textsc {i}}]63}/F_{\rm[C{\textsc {ii}}]158} ^{\mathrm{PDR}}$}](/articles/aa/full_html/2016/04/aa27667-15/aa27667-15-eq127.png)
Using the emission lines [N iii] 57 μm and [O iii] 88 μm, the N/O abundance number ratio can be estimated by the equation ![Mathematical equation: \begin{equation} \label{eq:NO ratio abundance m1-67} \frac{\mathrm{N}}{\mathrm{O}}=\frac{\langle \mathrm{N}^{++}\rangle} {\langle \mathrm{O}^{++}\rangle} =\frac{F_{\rm[N{\textsc {iii}}]57}/\varepsilon_{\rm[N{\textsc {iii}}]57}} {F_{\rm[O{\textsc {iii}}]88}/\varepsilon_{\rm[O{\textsc {iii}}]88}} , \end{equation}](/articles/aa/full_html/2016/04/aa27667-15/aa27667-15-eq132.png) (4)where F is the flux and ε is the volume emissivity of a given line. The emissivities were calculated with the package “nebular”, using the adopted value for the electron temperature and the previously calculated electron density. From the measured line fluxes and their uncertainties (Table 2), the N/O abundance ratio is 1.0 ± 0.5, a value that is much higher than the solar one, 0.14 (Grevesse et al. 2010). Given the uncertainties, it is in agreement with the value of Esteban et al. (1991) and similar to the values derived for other nebulae around WR stars (Smith 1997).
(4)where F is the flux and ε is the volume emissivity of a given line. The emissivities were calculated with the package “nebular”, using the adopted value for the electron temperature and the previously calculated electron density. From the measured line fluxes and their uncertainties (Table 2), the N/O abundance ratio is 1.0 ± 0.5, a value that is much higher than the solar one, 0.14 (Grevesse et al. 2010). Given the uncertainties, it is in agreement with the value of Esteban et al. (1991) and similar to the values derived for other nebulae around WR stars (Smith 1997).
5.2.5. Mass of the ionized gas
Based on the Hα emission we can estimate the ionized gas mass. Assuming a spherical nebula, the ionized mass in solar masses is given by (Vamvatira-Nakou et al. 2013) 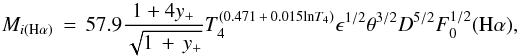 (5)where θ is the angular radius of the nebula (R = θD) in arcsec and y+ = nHe+/nH+.
Using the previous assumptions for the filling factor and the He+/ H+ abundance ratio, we estimated the mass of the ionized gas to be 1.5 ± 0.8 M⊙. For the higher filling factor, ϵ = 0.15, the ionized gas mass is 2.7 ± 1.4 M⊙.
Previous studies gave various results for the mass of ionized gas in the nebula that do not always agree with each other because different assumptions are made and different parameters are used. Cohen & Barlow (1975) assumed a filling factor of unity to obtain their ionized mass of 9 M⊙. Solf & Carsenty (1982) estimated a mass of about 0.8 M⊙, which as they reported, agrees with the value of Johnson (1980) and Chu & Treffers (1981). Later on, Grosdidier et al. (1998) estimated that the total mass of the ionized shell could be as low as about 1.33 M⊙. More recently, Cichowolski et al. (2008) calculated a mass of 5−9 M⊙, depending on the filling factor used (0.05−0.15).
If we consider the geometry of the nebula as described in Sect. 4, the shell has an inner radius of θin = 40′′ and an outer radius θout = 60′′. The mass of the ionized shell nebula is then given by 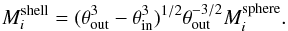 (6)The mass of the ionized shell nebula is thus 1.3 ± 0.7 M⊙ for ϵ = 0.05 and 2.3 ± 1.2 M⊙ for ϵ = 0.15. The quoted errors were estimated by propagating the uncertainties of the used quantities.
5.3. Photodissociation region characteristics
The detection of the other three emission lines, [O i] 63, 146 μm, and [C ii] 158 μm, may indicate the presence of a PDR in the nebula, because these fine structure lines are among the most important coolants in PDRs (Hollenbach & Tielens 1997). Nevertheless, a shock, resulting from the fast stellar wind that interacts with the slow expanding remnant formed in a previous stage of the stellar evolution, could also be the cause of the observed [O i] and [C ii] emission. In either case, the ratio [O i] 63 μm/[C ii] 158 μm can be used to exclude one of these two possible scenarios. This ratio is ≳10 in shocks (Hollenbach & McKee 1989; Castro-Carrizo et al. 2001), which is not the case for the nebula M1-67, where this ratio is equal to 0.6. Consequently, we can conclude that a PDR is probably responsible for the [O i] and [C ii] emission detected in the nebula M1-67.
In the past, PDRs were detected in some nebulae that surround LBV stars. First, Umana et al. (2009) discovered a PDR in the nebula around the LBV HR Car. Later on, Umana et al. (2010) observed a PDR in the nebula associated with the LBV candidate HD 168625. The analysis of Herschel data revealed the presence of a PDR in the nebula around the LBV WRAY 15-751 (Vamvatira-Nakou et al. 2013) and around the LBV AG Car (Vamvatira-Nakou et al. 2015).
It should be stressed here that the data were checked for possible background contamination and that there is no significant contribution from the background to none of the observed emission lines. The measured line fluxes come entirely from the nebula M1-67.
The C/O abundance ratio can be estimated based on the PDR line fluxes and following the method described in Vamvatira-Nakou et al. (2013) that was used to disentangle the contribution of the PDR and the H ii region to the flux of [C ii] 158 μm. In the ionized gas region, the ratio of fractional ionization is given by ![Mathematical equation: \begin{equation} \label{eq:fr ionization CN m1-67} \frac{\langle \mathrm{C}^{+}\rangle}{\langle \mathrm{N}^{+}\rangle}= \frac{F_{\rm[C{\textsc {ii}}]158}^{\rm H{\textsc {ii}}}/\varepsilon_{\rm[C{\textsc {ii}}]158}} {F_{\rm[N{\textsc {ii}}]122}/\varepsilon_{\rm[N{\textsc {ii}}]122}} , \end{equation}](/articles/aa/full_html/2016/04/aa27667-15/aa27667-15-eq156.png) (7)where we define
(7)where we define ![Mathematical equation: \hbox{$F_{\rm [C{\textsc {ii}}]158}^{\rm H{\textsc {ii}}} =\alpha F_{\rm [C{\textsc {ii}}]158}$}](/articles/aa/full_html/2016/04/aa27667-15/aa27667-15-eq157.png) , with F[Cii] 158 being the total flux of the [Cii] 158 μm line from Table 2 and α a factor to be determined. Assuming that ⟨ C+ ⟩ / ⟨ N+ ⟩ = C/N and calculating the emissivities using the package nebular, we end up with the following equation
, with F[Cii] 158 being the total flux of the [Cii] 158 μm line from Table 2 and α a factor to be determined. Assuming that ⟨ C+ ⟩ / ⟨ N+ ⟩ = C/N and calculating the emissivities using the package nebular, we end up with the following equation ![Mathematical equation: \begin{equation} \label{eq:cnratio m1-67} \frac{F_{\rm [C{\textsc {ii}}]158}^{\rm H{\textsc {ii}}}}{F_{\rm [N{\textsc {ii}}]122}}= (0.34 \pm 0.02) \ \frac{\mathrm{C}}{\mathrm{N}} \cdot \end{equation}](/articles/aa/full_html/2016/04/aa27667-15/aa27667-15-eq160.png) (8)Since N/O has been estimated to be ~1, we have
(8)Since N/O has been estimated to be ~1, we have 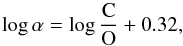 (9)using the observed ratio F[Cii] 158/F[Nii] 122 = 0.163 ± 0.048.
The theoretical F[Oi] 63/F[Oi] 146 ratio against the ![Mathematical equation: \hbox{$F_{\rm [O{\textsc {i}}]63}/F_{\rm [C{\textsc {ii}}]158}^{\mathrm{PDR}}$}](/articles/aa/full_html/2016/04/aa27667-15/aa27667-15-eq165.png) ratio normalized to the solar (C/O)⊙ = 0.5 abundance ratio is plotted in Fig. 8, following the study by Liu et al. (2001), so as to derive the C/O abundance ratio, as well as the temperature, TPDR, and the density, nH0, of the PDR (for details see Vamvatira-Nakou et al. 2013)4. Assuming that there is pressure equilibrium between the ionized gas region and the PDR, we have the following relation (Tielens 2005)
ratio normalized to the solar (C/O)⊙ = 0.5 abundance ratio is plotted in Fig. 8, following the study by Liu et al. (2001), so as to derive the C/O abundance ratio, as well as the temperature, TPDR, and the density, nH0, of the PDR (for details see Vamvatira-Nakou et al. 2013)4. Assuming that there is pressure equilibrium between the ionized gas region and the PDR, we have the following relation (Tielens 2005)  (10)which is used to define a locus of possible values in the diagram of Fig. 8.
From Fig. 8 we derive log(F[Oi] 63/ ![Mathematical equation: \hbox{$F_{\rm[C{\textsc {ii}}]158}^{\mathrm{PDR}})$}](/articles/aa/full_html/2016/04/aa27667-15/aa27667-15-eq170.png) + [C/O] = 1.1 where by definition [C/O] ≡ log(C/O) - log(C/O)⊙, using the constraints from Eq. (10) and the observed ratio F[Oi] 63/F[Oi] 146 = 26.8 ± 7.9. Finally, also using Eq. (9), we calculate α = 0.95 ± 0.03 and C/O = 0.46 ± 0.27, which is the solar abundance ratio considering the errors. From the calculated C/O and N/O abundance ratios and considering the N/H abundance ratio of Esteban et al. (1991), the C/H abundance ratio is then (1.3 ± 0.9) × 10-4. The contribution of the H ii region to the [C ii] 158 μm line flux is then
+ [C/O] = 1.1 where by definition [C/O] ≡ log(C/O) - log(C/O)⊙, using the constraints from Eq. (10) and the observed ratio F[Oi] 63/F[Oi] 146 = 26.8 ± 7.9. Finally, also using Eq. (9), we calculate α = 0.95 ± 0.03 and C/O = 0.46 ± 0.27, which is the solar abundance ratio considering the errors. From the calculated C/O and N/O abundance ratios and considering the N/H abundance ratio of Esteban et al. (1991), the C/H abundance ratio is then (1.3 ± 0.9) × 10-4. The contribution of the H ii region to the [C ii] 158 μm line flux is then ![Mathematical equation: \hbox{$F_{\rm[C{\textsc {ii}}]158}^ {H{\textsc {ii}}} =(2.02\pm0.42)\times 10^{-15}$}](/articles/aa/full_html/2016/04/aa27667-15/aa27667-15-eq175.png) W m-2, while the contribution of the PDR is
W m-2, while the contribution of the PDR is ![Mathematical equation: \hbox{$F_{\rm[C{\textsc {ii}}]158}^{\mathrm{PDR}} = (0.11\pm0.07)\times 10^{-15}$}](/articles/aa/full_html/2016/04/aa27667-15/aa27667-15-eq176.png) W m-2, recalling that these are the fluxes of the integration on the 25 spaxels and not the fluxes from the whole nebula.
W m-2, recalling that these are the fluxes of the integration on the 25 spaxels and not the fluxes from the whole nebula.
The values of the density and the temperature of the PDR are also provided by the diagram in Fig. 8. Using the observed F[Oi] 63/F[Oi] 146 ratio we find log nH0 = 4.43 ± 0.33 and TPDR ≃ 470 ± 330 K.
The total mass of hydrogen in the PDR, MH, can be estimated from the [C ii] 158 μm line flux, using the equation given in Vamvatira-Nakou et al. (2013) that is based on Tielens (2005). For the above PDR density, temperature, distance and C/H abundance, the neutral hydrogen mass is estimated to be MH = 0.05 ± 0.02 M⊙, which is a lower limit, since the 25 spaxels do not cover the whole nebula.
Since we naturally expect the PDR to be located just outside the H ii region, we checked for spatial variation of the [O i] 63 μm/[C ii] 158 μm line ratio. In three spaxels that correspond to nebular clumps this ratio is twice bigger than the average ratio. But the [O i] 63 μm/[O i] 146 μm is constant, given the large uncertainties. Moreover, when the method of disentangling the contribution of the PDR and the H ii to the flux of [C ii] 158 μm is performed on the brightest central spaxel (2,2), i.e. where the [O i] 63 μm/[C ii] 158 μm line ratio has the highest value, the result shows that the contribution of the PDR is not higher than the average over the 25 spaxels. Consequently, we conclude that no variation is detected, which is not surprising since the [C ii] line is dominated by the H ii region contribution and since the outskirts of the nebula are not in the field of view. On the other hand we cannot exclude that the PDR emission comes from dense clumps inside the H ii region as in the case of the planetary nebula NGC 650 (van Hoof et al. 2013).
6. Discussion
The parameters of WR 124 and its nebula M1-67 are summarized in Table 3. The stellar luminosity, effective temperature and distance are from the study of Marchenko et al. (2010). For the shell nebula that surrounds the star, the radii, the expansion velocity, the kinematic age, the electron density of the ionized gas, the adopted value of the electron temperature, the measured abundances and masses of dust and gas are given.
Parameters of the WR 124 and its nebula M1-67.
Concerning the expansion velocity of the nebula, Sirianni et al. (1998) discovered a bipolar outflow with an expansion velocity of 88 km s-1, apart from a spherical shell that expands with a velocity of 46 km s-1. Van der Sluys & Lamers (2003) found an expansion velocity of 150 km s-1 for the structure of the nebula that expands freely and which is not located on the surface of the bow shock. Consequently, the kinematic age, tkin, of the nebula M1-67 can be estimated, considering an expansion velocity that can be between 50 and 150 km s-1. Since the nebula extends up to 1 pc from its central star, its kinematic age is tkin = r/vexp = (6.5−20.0) × 103 years. The temporal difference between the inner and the outer radius of the nebula is (2.3−7.0) × 103 years.
The N/O ratio calculated in this study is the same as the ratio measured in the nebula around the LBV WRAY 15-751 (Vamvatira-Nakou et al. 2013) and is similar to the ratio of the nebula around the LMC LBV R127 (Smith et al. 1998). With respect to the solar N/O abundance ratio used by Ekström et al. (2012)5, it is enhanced by a factor of 8. Considering the 12+log(N/H) abundance of 8.45 calculated by Esteban et al. (1991) and our calculation for the C/O abundance ratio, we find that these ratios correspond to an enhancement in N/H by a factor of 5 and a depletion in C/H and O/H by roughly a factor of 2 with respect to the solar abundances used in the models of Ekström et al. (2012). Our results point to a nebula composed of processed material as is the case of other nebulae around LBVs and WR stars (Smith 1997).
The total gas mass and the corresponding mass-loss rate during the ejection cannot be estimated without making assumptions. A typical value for the dust-to-gas ratio is 100 in such stellar environments. With this assumption, the total nebular mass is about 22 M⊙, using the calculated dust mass. But this ratio might be lower as in the case of the LBV WRAY 15-751 (Vamvatira-Nakou et al. 2013), where it was calculated to be 40. In this case, the mass is about 9 M⊙, still a factor 2 higher than the sum of the ionized and neutral gas mass, suggesting that the mass of the gas might be underestimated.
We also compute a lower limit to the total mass-loss rate using the ionized gas, neutral gas, and dust masses. Since the ionized gas mass varies with respect to the filling factor used for its calculation (Sect. 5), we use the lower value given in Table 3. The lower limit of the mass-loss rate at the time of the nebular ejection is then calculated to be log Ṁ = −4.0, where Ṁ is in M⊙ yr-1, considering the higher value of the temporal difference between the inner and the outer radii of the nebula (which corresponds to the lower expansion velocity).
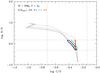 |
Fig. 9 Evolution of the N/O versus the C/O surface abundance ratios for a 32 M⊙ star of solar metallicity and for initial rotation rates Ω / Ωcrit from 0 to 0.4, using the models of Ekström et al. (2012). The dashed lines correspond to the values measured for the nebula M1-67, with their errors. The thicker lines emphasize the part of the tracks compatible with the measurements. For clarity, the tracks are stopped at the beginning of the blue loop (data point No. 210 in Ekström et al. 2012). |
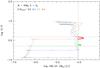 |
Fig. 10 Evolution of the N/O surface abundance ratio as a function of the mass-loss rate for a 32 M⊙ star of solar metallicity and for initial rotation rates Ω / Ωcrit from 0 to 0.4, using the models of Ekström et al. (2012). The dashed lines correspond to the calculated value of N/O for the nebula M1-67, with its errors, and to the lower limit of the mass-loss rate. The thicker lines emphasize the part of the tracks compatible with the measurements. For clarity, the tracks are stopped at the beginning of the blue loop (data point No. 210 in Ekström et al. 2012). |
These results can be used to constrain the evolutionary phase of the central star at which the nebula was ejected with the help of the evolutionary models of Ekström et al. (2012), keeping in mind that the models of massive star evolution are very uncertain in the post-main-sequence evolutionary phases because they do not include any eruptive event so that the mass-loss rate recipes are not well known (Smith 2014). The limit of the mass-loss rate along with the calculated nebular abundance ratios of N/O and C/O that are assumed to be the surface abundance ratios at the time of the nebular ejection were thus compared to the theoretical evolution of these parameters according to the models of Ekström et al. (2012). The stellar initial mass is constrained by the stellar luminosity (Table 3). Models with rotation rates Ω / Ωcrit = 0.0−0.4 and solar metallicities were considered. The evolution of the C/O abundance ratio versus the N/O abundance ratio for a star of initial mass 32 M⊙ is illustrated in Fig. 9. The calculated values for these two parameters with their errors are plotted with dashed lines, while the part of these tracks that is compatible with our results is emphasized with thicker lines. In Fig. 10 the evolution of the mass-loss rate versus the N/O abundance ratio is plotted. The constraints from these two diagrams are then reported in the Hertzsprung-Russel (HR) diagram for a star of 32 M⊙ to identify which stellar evolution stages correspond to our measurements (Fig. 11).
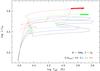 |
Fig. 11 Evolutionary path in the HR diagram of a 32 M⊙ star of solar metallicity and for initial rotation rates Ω / Ωcrit from 0 to 0.4, using the models of Ekström et al. (2012). The thicker lines emphasize the part of the tracks compatible with the N/O and C/O abundance ratios and the mass-loss rate derived from the nebula M1-67. For clarity, the tracks are stopped when the current values of the stellar parameters (Table 3) are reached, considering their errors (data point No. 310 in Ekström et al. 2012). |
Models of different initial stellar mass were tested for compatibility with the calculated abundance ratios and mass-loss rate. The data are compatible with the evolutionary tracks of a star with an initial mass between 30 M⊙ and 35 M⊙ and solar metallicity, where the 32 M⊙ model is the most compatible one. High rotational velocities cannot be excluded. The ejection of the nebula (thick part of the model tracks of Fig. 11) took place when the star was in a RSG/yellow supergiant (YSG) phase. The star then moved toward its current WR phase. The evolutionary tracks of this model are compatible with the current location of the star on the HR diagram according to its stellar parameters, within the uncertainties. Models with higher initial mass are not compatible with the current location of the star because they predict higher luminosity. Models with lower initial mass are not compatible with the constraints from the calculated abundance ratios and mass-loss rate.
The time elapsed between the ejection phase and the WR phase, as computed from the model, is at least two times longer than the kinematic age of the nebula calculated with the adopted expansion velocity (Table 3). This means that the nebula is expected to be older and bigger. This difference can be explained by the presence of the bow shock caused by the fast stellar motion. In this case, the radius of the nebula toward its front is fixed and does not change with time. So the ejected material from the star flows on the surface of the bow shock (Van der Sluys & Lamers 2003). This results in a smaller size of the nebula and a correspondingly kinematic age lower than the actual age.
7. Conclusions
The Herschel photometric and spectroscopic data analysis of the nebula M1-67 around the Wolf-Rayet star WR 124 has been presented, together with optical imaging data. The images show a clumpy dusty nebula that coincides with the gas nebula, indicating that the dust and the gas are mixed. As for LBV nebulae, a photodissociation region was revealed from the infrared spectroscopic data analysis, either surrounding the ionized gas nebula or originating in the clumps.
The dust nebula model was performed using a two-dimensional radiative transfer code. Two populations of dust grains with different grain sizes but with the same composition-olivines with 50/50 Fe to Mg abundance – were needed to reproduce the infrared SED. Large dust grains appear necessary. Large grains were also found in the dust nebula around the LBV WRAY 15-751 (Vamvatira-Nakou et al. 2013), the LBV AG Car (Vamvatira-Nakou et al. 2015) and the yellow hypergiant Hen 3-1379, which is a possible pre-LBV (Hutsemékers et al. 2013). Models by Kochanek (2011; 2014) show that large dust grains can be produced during a LBV eruption.
The analysis of the emission line infrared spectrum points toward a nebula composed of enriched material, which is a common feature in the nebulae of WR and LBV that show the CNO-cycle imprints.
The calculated mass-loss rate and the abundance ratios were used to constrain the evolutionary stage of the star when the nebular ejection took place, with the help of theoretical stellar evolution models. The results suggest that the ejection of the material that forms the nebula M1-67 around the Wolf-Rayet star WR 124 occurred during a RSG/YSG phase of a star with initial mass of 32 M⊙.
The SPIRE images are not presented here because the nebula is barely resolved because of the low resolution.
Although there are also SPIRE observations of the spectrum of the nebula M1-67, taken in the framework of the MESS program, they cannot be used to have a more precise flux for the line [N ii] 205 μm. That is due to the combination of the geometry of the detector array and the geometry of the nebula and because the observing mode was a single pointing and not a raster map, in such a way that any attempt to recover the nebular flux is highly uncertain. As a result, we decided not to include the SPIRE spectroscopic data in this study.
The difference between the diagnostic diagram of Liu et al. (2001) and ours is due to the use of updated collision coefficients. We also consider a wider range of density and temperature values.
Acknowledgments
We thank Dr. Nick Cox for providing the scanamorphos images and Dr. Yaël Nazé and Prof. Gregor Rauw for their valuable comments on the manuscript. C.V.N., D.H., P.R., and M.A.T.G. acknowledge support from the Belgian Federal Science Policy Office via the PRODEX Program of ESA. The Liège team also acknowledges support from the FRS-FNRS (Comm. Franç. de Belgique). PACS has been developed by a consortium of institutes led by MPE (Germany) and including UVIE (Austria); KU Leuven, CSL, IMEC (Belgium); CEA, LAM (France); MPIA (Germany); INAF-IFSI/OAA/OAP/OAT, LENS, SISSA (Italy); IAC (Spain). This development has been supported by the funding agencies BMVIT (Austria), ESA-PRODEX (Belgium), CEA/CNES (France), DLR (Germany), ASI/INAF (Italy), and CICYT/MCYT (Spain). Data presented in this paper were analyzed using “HIPE”, a joint development by the Herschel Science Ground Segment Consortium, consisting of ESA, the NASA Herschel Science Center, and the HIFI, PACS and SPIRE consortia. This research made use of the NASA/IPAC Infrared Science Archive, which is operated by the Jet Propulsion Laboratory, California Institute of Technology.
References
- Asplund, M., Grevesse, N., & Sauval, A. J. 2005, ASP Conf. Ser., 336, 25 [Google Scholar]
- Barker, T. 1978, ApJ, 219, 914 [NASA ADS] [CrossRef] [Google Scholar]
- Beichman, C. A., Neugebauer, G., Habing, H. J., Clegg, P. E., & Chester, T. J. 1988, Infrared Astronomical Satellite (IRAS) Catalogs and Atlases, Vol. 1, Explanatory Supplement [Google Scholar]
- Bertola, F. 1964, PASP, 76, 241 [NASA ADS] [CrossRef] [Google Scholar]
- Castro-Carrizo, A., Bujarrabal, V., Fong, D., et al. 2001, A&A, 367, 674 [NASA ADS] [CrossRef] [EDP Sciences] [Google Scholar]
- Cichowolski, S., Pineault, S., Arnal, E. M., & Cappa, C. E. 2008, A&A, 478, 443 [NASA ADS] [CrossRef] [EDP Sciences] [Google Scholar]
- Chu, Y.-H., & Treffers, R. R. 1981, ApJ, 249, 586 [NASA ADS] [CrossRef] [Google Scholar]
- Chu, Y.-H., Treffers, R. R., & Kwitter, K. B. 1983, ApJS, 53, 937 [NASA ADS] [CrossRef] [Google Scholar]
- Cohen, M., & Barlow, M. J. 1975, ApL, 16, 165 [NASA ADS] [Google Scholar]
- Crawford, I. A., & Barlow, M. J. 1991, A&A, 249, 518 [NASA ADS] [Google Scholar]
- Crowther, P. A. 2007, ARA&A, 45, 177 [NASA ADS] [CrossRef] [Google Scholar]
- Dopita, M. A., Bell, J. F., Chu, Y.-H., & Lozinskaya, T. A. 1994, ApJS, 93, 455 [NASA ADS] [CrossRef] [Google Scholar]
- Dorschner, J., Begemann, B., Henning, T., Jaeger, C., & Mutschke, H. 1995, A&A, 300, 503 [NASA ADS] [Google Scholar]
- Draine, B. T. 2011, Physics of the Interstellar and Intergalactic Medium (Princeton University Press) [Google Scholar]
- Ekström, S., Georgy, C., Eggenberger, P., et al. 2012, A&A, 537, A146 [NASA ADS] [CrossRef] [EDP Sciences] [Google Scholar]
- Esteban, C., Vilchez, J. M., Manchado, A., & Smith, L. J. 1991, A&A, 244, 205 [NASA ADS] [Google Scholar]
- Fernández-Martín, A., Vílchez, J. M., Pérez-Montero, E., et al. 2013, A&A, 554, A104 [NASA ADS] [CrossRef] [EDP Sciences] [Google Scholar]
- Grevesse, N., Asplund, M., Sauval, A. J., & Scott, P. 2010, Ap&SS, 328, 179 [NASA ADS] [CrossRef] [Google Scholar]
- Griffin, M. J., Abergel, A., Abreu, A., et al. 2010, A&A, 518, L3 [Google Scholar]
- Groenewegen, M. A. T., Waelkens, C., Barlow, M. J., et al. 2011, A&A, 526, A162 [NASA ADS] [CrossRef] [EDP Sciences] [Google Scholar]
- Grosdidier, Y., Moffat, A. F. J., Joncas, G., & Acker, A. 1998, ApJ, 506, L127 [NASA ADS] [CrossRef] [Google Scholar]
- Grosdidier, Y., Moffat, A. F. J., Joncas, G., & Acker, A. 1999, ASP Conf. Ser., 168, 453 [NASA ADS] [Google Scholar]
- Grosdidier, Y., Moffat, A. F. J., Blais-Ouellette, S., Joncas, G., & Acker, A. 2001, ApJ, 562, 753 [NASA ADS] [CrossRef] [Google Scholar]
- Gvaramadze, V. V., Kniazev, A. Y., & Fabrika, S. 2010, MNRAS, 405, 1047 [NASA ADS] [Google Scholar]
- Hamann, W. R., Koesterke, L., & Wessolowski, U. 1993, A&A, 274, 397 [NASA ADS] [Google Scholar]
- Hollenbach, D., & McKee, C. F. 1989, ApJ, 342, 306 [NASA ADS] [CrossRef] [Google Scholar]
- Hollenbach, D. J., & Tielens, A. G. G. M. 1997, ARA&A, 35, 179 [NASA ADS] [CrossRef] [Google Scholar]
- Hutsemékers, D. 1994, A&A, 281, L81 [NASA ADS] [Google Scholar]
- Hutsemékers, D., Cox, N. L. J., & Vamvatira-Nakou, C. 2013, A&A, 552, L6 [NASA ADS] [CrossRef] [EDP Sciences] [Google Scholar]
- Johnson, H. M. 1980, ApJ, 235, 66 [NASA ADS] [CrossRef] [Google Scholar]
- Kochanek, C. S. 2011, ApJ, 743, 73 [NASA ADS] [CrossRef] [Google Scholar]
- Kochanek, C. S. 2014, MNRAS, submitted [arXiv:1407.7856] [Google Scholar]
- Liu, X.-W., Barlow, M. J., Cohen, M., et al. 2001, MNRAS, 323, 343 [NASA ADS] [CrossRef] [Google Scholar]
- Maeder, A., & Meynet, G. 2010, New Astron. Rev., 54, 32 [NASA ADS] [CrossRef] [Google Scholar]
- Marchenko, S. V., Moffat, A. F. J., & Crowther, P. A. 2010, ApJ, 724, L90 [NASA ADS] [CrossRef] [Google Scholar]
- Marston, A. P. 1997, ApJ, 475, 188 [NASA ADS] [CrossRef] [Google Scholar]
- Mathis, J. S., Rumpl, W., & Nordsieck, K. H. 1977, ApJ, 217, 425 [NASA ADS] [CrossRef] [Google Scholar]
- Merrill, P. W. 1938, PASP, 50, 350 [NASA ADS] [CrossRef] [Google Scholar]
- Minkowski, R. 1946, PASP, 58, 305 [NASA ADS] [CrossRef] [Google Scholar]
- Milne, D. K., & Aller, L. H. 1975, A&A, 38, 183 [NASA ADS] [Google Scholar]
- Moshir, M., Kopman, G., & Conrow, T. A. O. 1992, IRAS Faint Source Survey, Explanatory supplement version 2 [Google Scholar]
- Müller T., Okumura K., & Klaas U. 2011, PACS Photometer Passbands and Colour Correction Factors for Various Source SEDs [Google Scholar]
- Neugebauer, G., Habing, H. J., van Duinen, R., et al. 1984, ApJ, 278, 1 [NASA ADS] [CrossRef] [Google Scholar]
- Nota, A., Clampin, M., Sirianni, M., Greenfield, P., & Golimowski, D. A. 1995a, IAU Symp., 163, 78 [NASA ADS] [CrossRef] [Google Scholar]
- Nota, A., Livio, M., Clampin, M. & Schulte-Ladbeck, R., 1995b, ApJ, 448, 788 [NASA ADS] [CrossRef] [Google Scholar]
- Osterbrock, D. E., & Ferland, G. J., 2006, Astrophysics of Gaseous Nebulae and Active Galactic Nuclei (University Sciences Books) [Google Scholar]
- Ott, S. 2010, ASP Conf. Ser., 434, 139 [Google Scholar]
- Perek, L., & Kohoutek, L. 1967, Catalogue of galactic planetary nebulae, Prague, Czechoslovak Institute of Science [Google Scholar]
- Pilbratt, G. L., Riedinger, J. R., Passvogel, T., et al. 2010, A&A, 518, L1 [CrossRef] [EDP Sciences] [Google Scholar]
- Pismis, P., & Recillas-Cruz, E. 1979, Rev. Mex. Astron. Astrof., 4, 271 [Google Scholar]
- Poglitsch, A., Waelkens, C., Geis, N., et al. 2010, A&A, 518, L2 [NASA ADS] [CrossRef] [EDP Sciences] [Google Scholar]
- Roussel, H. 2013, PASP, 125, 1126 [Google Scholar]
- Rubin, R. H. 1989, ApJS, 69, 897 [NASA ADS] [CrossRef] [Google Scholar]
- Rubin, R. H., Simpson, J. P., Lord, S. D., et al. 1994, ApJ, 420, 772 [NASA ADS] [CrossRef] [Google Scholar]
- Sharpless, S. 1959, ApJS, 4, 257 [Google Scholar]
- Shaw, R. A., & Dufour, R. J. 1995, PASP, 107, 896 [NASA ADS] [CrossRef] [Google Scholar]
- Sirianni, M., Nota, A., Pasquali, A., & Clampin, M. 1998, A&A, 335, 1029 [NASA ADS] [Google Scholar]
- Smith, L. F. 1973, in IAU Symp. 49, ed. M. K. V. Bappu, & J. Sahade (Dordrecht: Reidel), 15 [Google Scholar]
- Smith, L. F., & Aller, L. H. 1969, ApJ, 157, 1245 [NASA ADS] [CrossRef] [Google Scholar]
- Smith, L. J. 1997, ASP Conf. Ser., 120, 310 [NASA ADS] [Google Scholar]
- Smith, L. J., Nota, A., Pasquali, A., et al. 1998, ApJ, 503, 278 [NASA ADS] [CrossRef] [Google Scholar]
- Smith, N. 2014, ARA&A, 52, 487 [NASA ADS] [CrossRef] [MathSciNet] [Google Scholar]
- Solf, J., & Carsenty, U. 1982, A&A, 116, 54 [NASA ADS] [Google Scholar]
- Tielens, A. G. G. M. 2005, The Physics and Chemistry of the Interstellar Medium (Cambridge University Press) [Google Scholar]
- Tody, D. 1986, The IRAF Data Reduction and Analysis System in Proc. SPIE Instrumentation in Astronomy VI, ed. D. L. Crawford, 627, 733 [Google Scholar]
- Tody, D. 1993, IRAF in the Nineties in Astronomical Data Analysis Software and Systems II, eds. R. J. Hanisch, R. J. V. Brissenden, & J. Barnes, ASP Conf. Ser., 52, 173 [Google Scholar]
- Tsamis, Y. G., Barlow, M. J., Liu, X.-W., Danziger, I. J., & Storey, P. J. 2003, MNRAS, 345, 186 [NASA ADS] [CrossRef] [Google Scholar]
- Ueta, T., & Meixner, M. 2003, ApJ, 586, 1338 [NASA ADS] [CrossRef] [Google Scholar]
- Umana, G., Buemi, C. S., Trigilio, C., et al. 2009, ApJ, 694, 697 [NASA ADS] [CrossRef] [Google Scholar]
- Umana, G., Buemi, C. S., Trigilio, C., et al. 2010, ApJ, 718, 1036 [NASA ADS] [CrossRef] [Google Scholar]
- Vamvatira-Nakou, C., Hutsemékers, D., Royer, P., et al. 2013, A&A, 557, A20 [NASA ADS] [CrossRef] [EDP Sciences] [Google Scholar]
- Vamvatira-Nakou, C., Hutsemékers, D., Royer, P., et al. 2015, A&A, 578, A108 [NASA ADS] [CrossRef] [EDP Sciences] [Google Scholar]
- van der Sluys, M. V., & Lamers, H. J. G. L. M. 2003, A&A, 398, 181 [NASA ADS] [CrossRef] [EDP Sciences] [Google Scholar]
- van Hoof, P. A. M., Van de Steene, G. C., Exter, K. M., et al. 2013, A&A, 560, A7 [NASA ADS] [CrossRef] [EDP Sciences] [Google Scholar]
Appendix
Line fluxes in each spaxel. A dash indicates a poor S/N or a non-detection.
Appendix B: Emission line fluxes for each spaxel
The emission line flux measurements from the spectrum of each one of the 25 spaxels are given in Table A.1. The first column contains the detected ions. Subsequent columns contain the line fluxes in W/m2 along with their errors. In addition, the spaxel numbers (Fig. 5) are given in every cell of the table. The quoted uncertainties are the sum of the line-fitting uncertainty plus the uncertainty due to the position of the continuum.
Appendix C: Emission line fluxes from ISO data
The LWS observations of M1-67 were taken on day 725 of the ISO mission. They consist of a 2228-s “on” spectrum (80′′ circular aperture) and a 1330-s “off” spectrum acquired 7′ away from M1-67.
The forbidden emission lines [N ii] 122 μm and [C ii] 158 μm are detected well in this spectrum. The flux in the [N ii] 122 μm line from the LWS spectrum is 15.0 × 10⁻¹⁵ W m-2, in good agreement with the PACS measurement of 13.05 × 10⁻¹⁵ W m-2 in its 45″ × 45′′ IFU. The LWS on-spectrum gives a flux of 3.8 × 10⁻¹⁵ W m-2 in the [C ii] 158 μm line, while the off-spectrum gives a [C ii] flux of 1.45 × 10⁻¹⁵ W m-2 from the diffuse ISM, i.e. 38% of the on-spectrum value. The net on-off ISO-LWS [C ii] flux from the nebula is therefore 2.35 × 10⁻¹⁵ W m-2, in agreement with the PACS IFU [C ii] flux of 2.13 × 10⁻¹⁵ W m-2. The PACS spectrum was obtained in chopping mode, so that an “off” region spectrum was subtracted from the “on” spectrum.
All Tables
All Figures
|
Fig. 1 PACS images of the nebula M1-67 at 70 μm, 100 μm, and 160 μm, from left to right. The size of each image is 4′× 4′. The scale on the right corresponds to the surface brightness (arbitrary units) and is logarithmic to better show the faint emission. The white circles in the upper right corner of each image represent the PSF size. North is up and east to the left. |
| In the text | |
|
Fig. 2 Left: view of the optical Hα+[Nii] emission from the nebula M1-67. Center: contour image of the Hα+[Nii] emission from the nebula (green lines) superposed on the PACS infrared image of the nebula at 70 μm (shown also in Fig. 1 at the same scale). Right: view of the nebula in the continuum filter. This continuum image has been subtracted from the image obtained in the Hα+[Nii] filter to create the image seen in the leftmost panel and to emphasize the ionized gas emission. The size of each image is 4′× 4′ and the scale is logarithmic to better show the faint emission. North is up and east to the left. |
| In the text | |
|
Fig. 3 Three-color (70 μm in blue, 100 μm in green, and 160 μm in red) image of the nebula M1-67. The nebula appears located inside a cavity in the interstellar medium. The scale is logarithmic for all three colors. The size of the image is 15′× 15′. North is up and east to the left. |
| In the text | |
|
Fig. 4 Infrared SED of the nebula M1-67 around the Wolf-Rayet star WR 124 from color-corrected photometric measurements from IRAS and Herschel (PACS and SPIRE) space missions. The best result of the 2-Dust model fitting is illustrated (solid line). It was achieved by considering two populations of dust grains (dashed lines), a population of small grains with radii from 0.005 to 0.1μm, responsible for the emission at λ< 40 μm and a population of large grains with radii from 2 to 10μm, responsible for the infrared SED at λ> 70 μm. Data at λ< 20 μm are not considered in the fit. |
| In the text | |
|
Fig. 5 Footprint of the PACS spectral field-of-view on the image of the nebula M1-67 at 70 μm. This field is composed of 5 × 5 spaxels, each one of them labeled with a number pair. North is up and east is to the left. |
| In the text | |
|
Fig. 6 Integrated PACS spectrum of the nebula M1-67 around the WR 124 star over the 25 spaxels. The forbidden emission line [N iii] 57 μm is detected. |
| In the text | |
|
Fig. 7 Integrated PACS spectra of the nebula M1-67 around the WR 124 star over the 25 spaxels. The detected forbidden emission lines are [O i] 63 μm, [O iii] 88 μm, [N ii] 122 μm, [O i] 146 μm, [C ii] 158 μm, and [N ii] 205 μm. |
| In the text | |
|
Fig. 8 Temperature-density PDR diagnostic diagram. The grid of flux ratios F[Oi] 63/F[Oi] 146 versus |
| In the text | |
|
Fig. 9 Evolution of the N/O versus the C/O surface abundance ratios for a 32 M⊙ star of solar metallicity and for initial rotation rates Ω / Ωcrit from 0 to 0.4, using the models of Ekström et al. (2012). The dashed lines correspond to the values measured for the nebula M1-67, with their errors. The thicker lines emphasize the part of the tracks compatible with the measurements. For clarity, the tracks are stopped at the beginning of the blue loop (data point No. 210 in Ekström et al. 2012). |
| In the text | |
|
Fig. 10 Evolution of the N/O surface abundance ratio as a function of the mass-loss rate for a 32 M⊙ star of solar metallicity and for initial rotation rates Ω / Ωcrit from 0 to 0.4, using the models of Ekström et al. (2012). The dashed lines correspond to the calculated value of N/O for the nebula M1-67, with its errors, and to the lower limit of the mass-loss rate. The thicker lines emphasize the part of the tracks compatible with the measurements. For clarity, the tracks are stopped at the beginning of the blue loop (data point No. 210 in Ekström et al. 2012). |
| In the text | |
|
Fig. 11 Evolutionary path in the HR diagram of a 32 M⊙ star of solar metallicity and for initial rotation rates Ω / Ωcrit from 0 to 0.4, using the models of Ekström et al. (2012). The thicker lines emphasize the part of the tracks compatible with the N/O and C/O abundance ratios and the mass-loss rate derived from the nebula M1-67. For clarity, the tracks are stopped when the current values of the stellar parameters (Table 3) are reached, considering their errors (data point No. 310 in Ekström et al. 2012). |
| In the text | |
Current usage metrics show cumulative count of Article Views (full-text article views including HTML views, PDF and ePub downloads, according to the available data) and Abstracts Views on Vision4Press platform.
Data correspond to usage on the plateform after 2015. The current usage metrics is available 48-96 hours after online publication and is updated daily on week days.
Initial download of the metrics may take a while.