Fig. 2
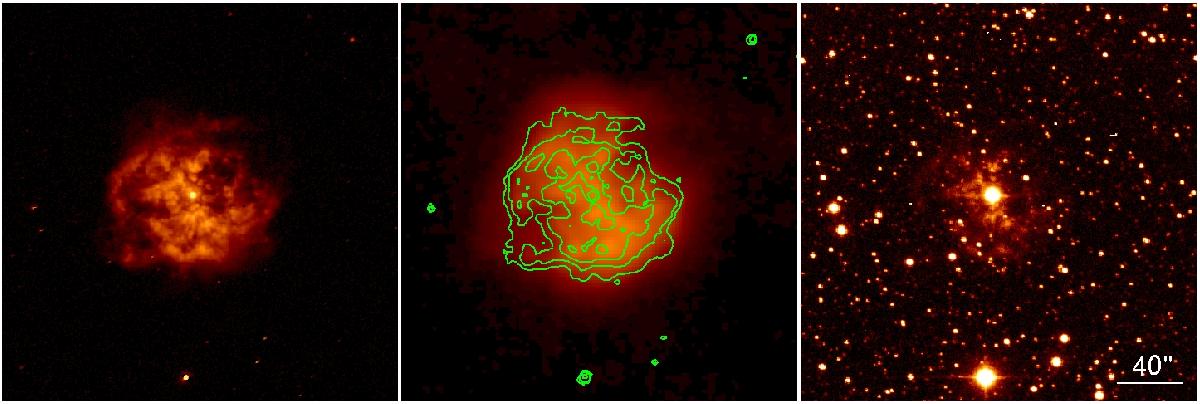
Left: view of the optical Hα+[Nii] emission from the nebula M1-67. Center: contour image of the Hα+[Nii] emission from the nebula (green lines) superposed on the PACS infrared image of the nebula at 70 μm (shown also in Fig. 1 at the same scale). Right: view of the nebula in the continuum filter. This continuum image has been subtracted from the image obtained in the Hα+[Nii] filter to create the image seen in the leftmost panel and to emphasize the ionized gas emission. The size of each image is 4′× 4′ and the scale is logarithmic to better show the faint emission. North is up and east to the left.
Current usage metrics show cumulative count of Article Views (full-text article views including HTML views, PDF and ePub downloads, according to the available data) and Abstracts Views on Vision4Press platform.
Data correspond to usage on the plateform after 2015. The current usage metrics is available 48-96 hours after online publication and is updated daily on week days.
Initial download of the metrics may take a while.