Fig. 10
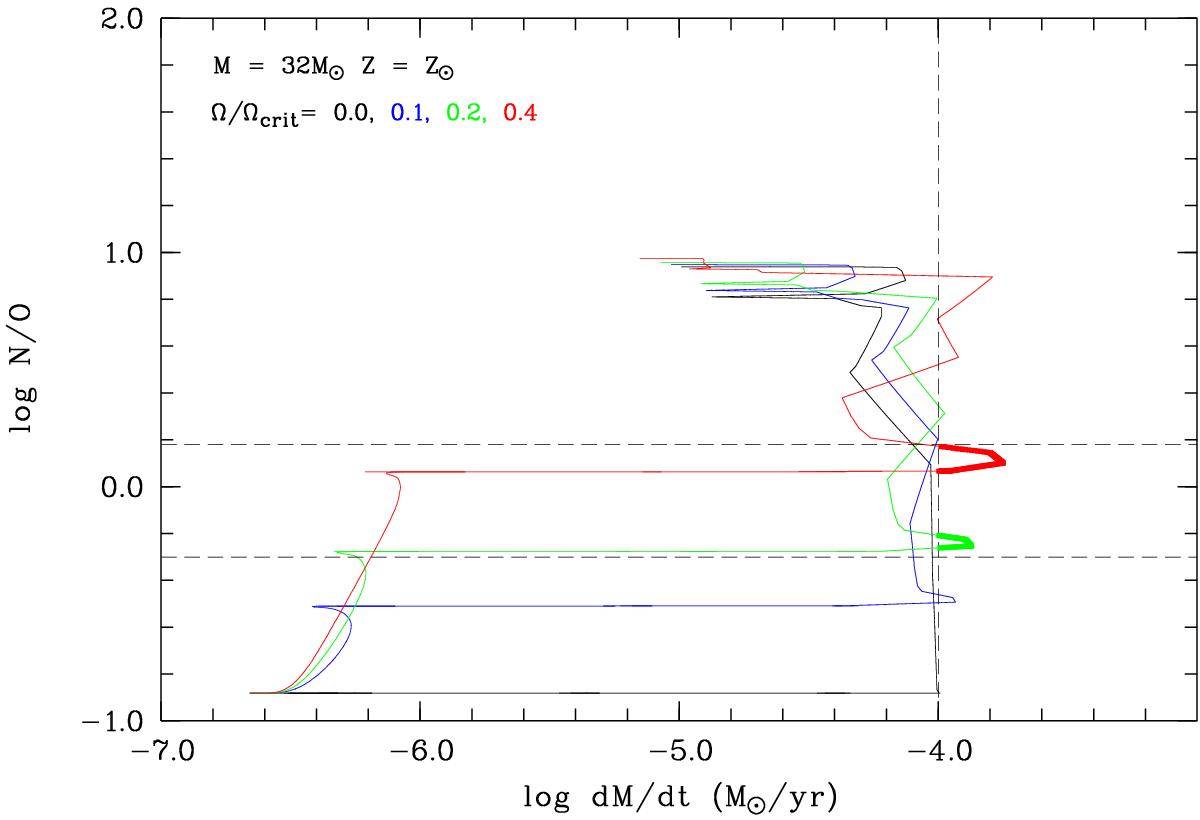
Evolution of the N/O surface abundance ratio as a function of the mass-loss rate for a 32 M⊙ star of solar metallicity and for initial rotation rates Ω / Ωcrit from 0 to 0.4, using the models of Ekström et al. (2012). The dashed lines correspond to the calculated value of N/O for the nebula M1-67, with its errors, and to the lower limit of the mass-loss rate. The thicker lines emphasize the part of the tracks compatible with the measurements. For clarity, the tracks are stopped at the beginning of the blue loop (data point No. 210 in Ekström et al. 2012).
Current usage metrics show cumulative count of Article Views (full-text article views including HTML views, PDF and ePub downloads, according to the available data) and Abstracts Views on Vision4Press platform.
Data correspond to usage on the plateform after 2015. The current usage metrics is available 48-96 hours after online publication and is updated daily on week days.
Initial download of the metrics may take a while.