Free Access
Fig. 5
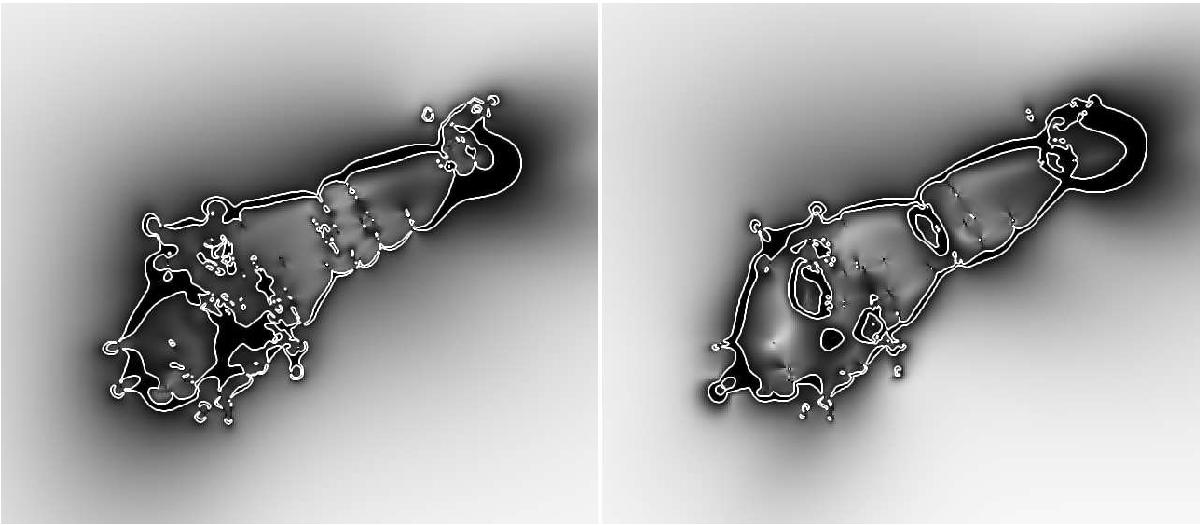
Map (310″ × 310″) of the signal-to-noise ratio of the amplification, for the cored (left) and the non-cored (right) mass models. White lines indicate where the signal-to-noise ratio equals 3. Darker areas interior to these lines correspond to regions where the signal-to-noise ratio is less than 3.
Current usage metrics show cumulative count of Article Views (full-text article views including HTML views, PDF and ePub downloads, according to the available data) and Abstracts Views on Vision4Press platform.
Data correspond to usage on the plateform after 2015. The current usage metrics is available 48-96 hours after online publication and is updated daily on week days.
Initial download of the metrics may take a while.