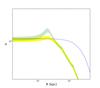
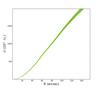
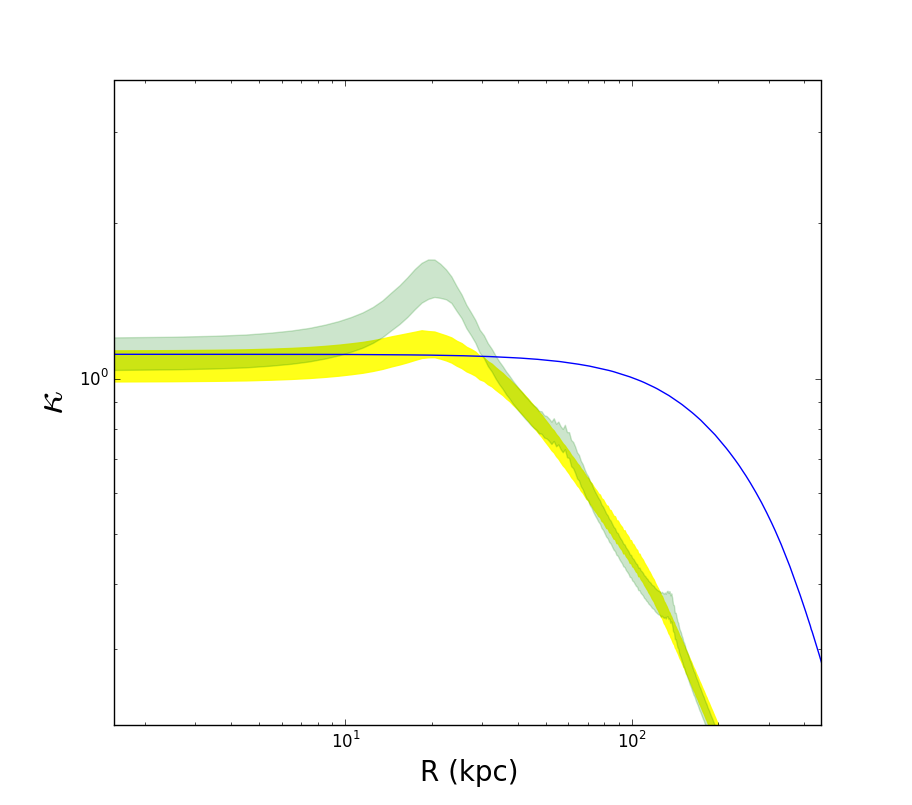
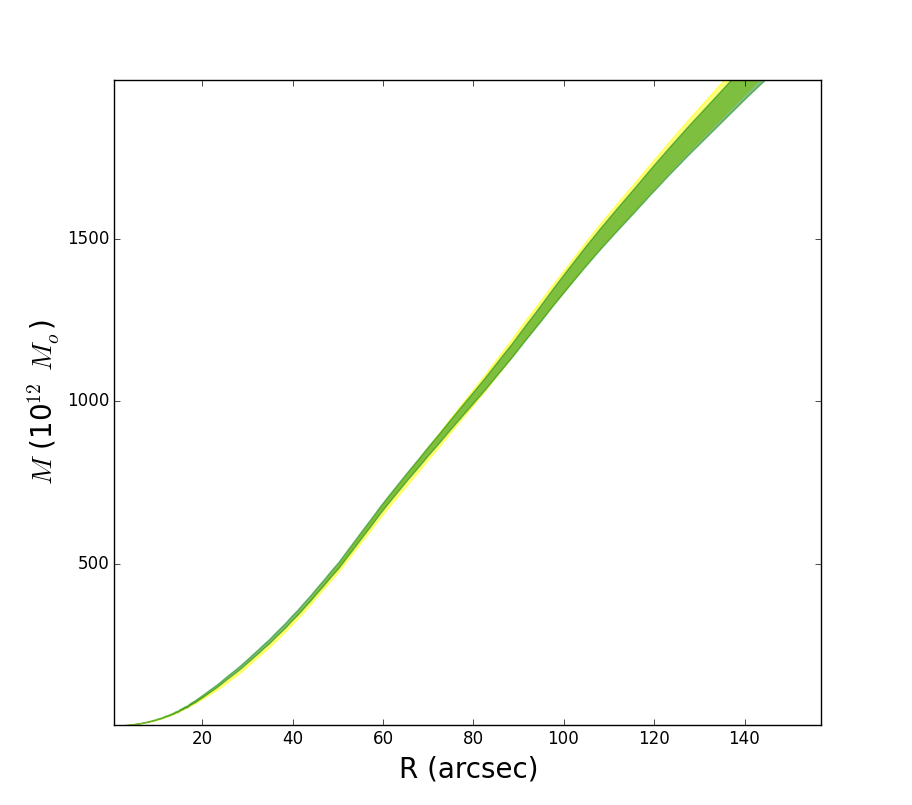
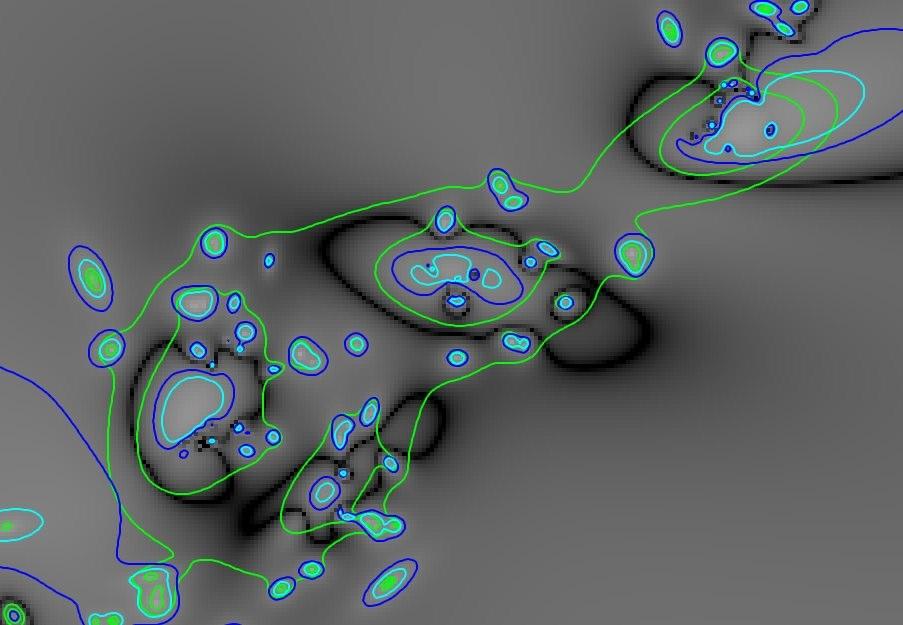
Fig. 4
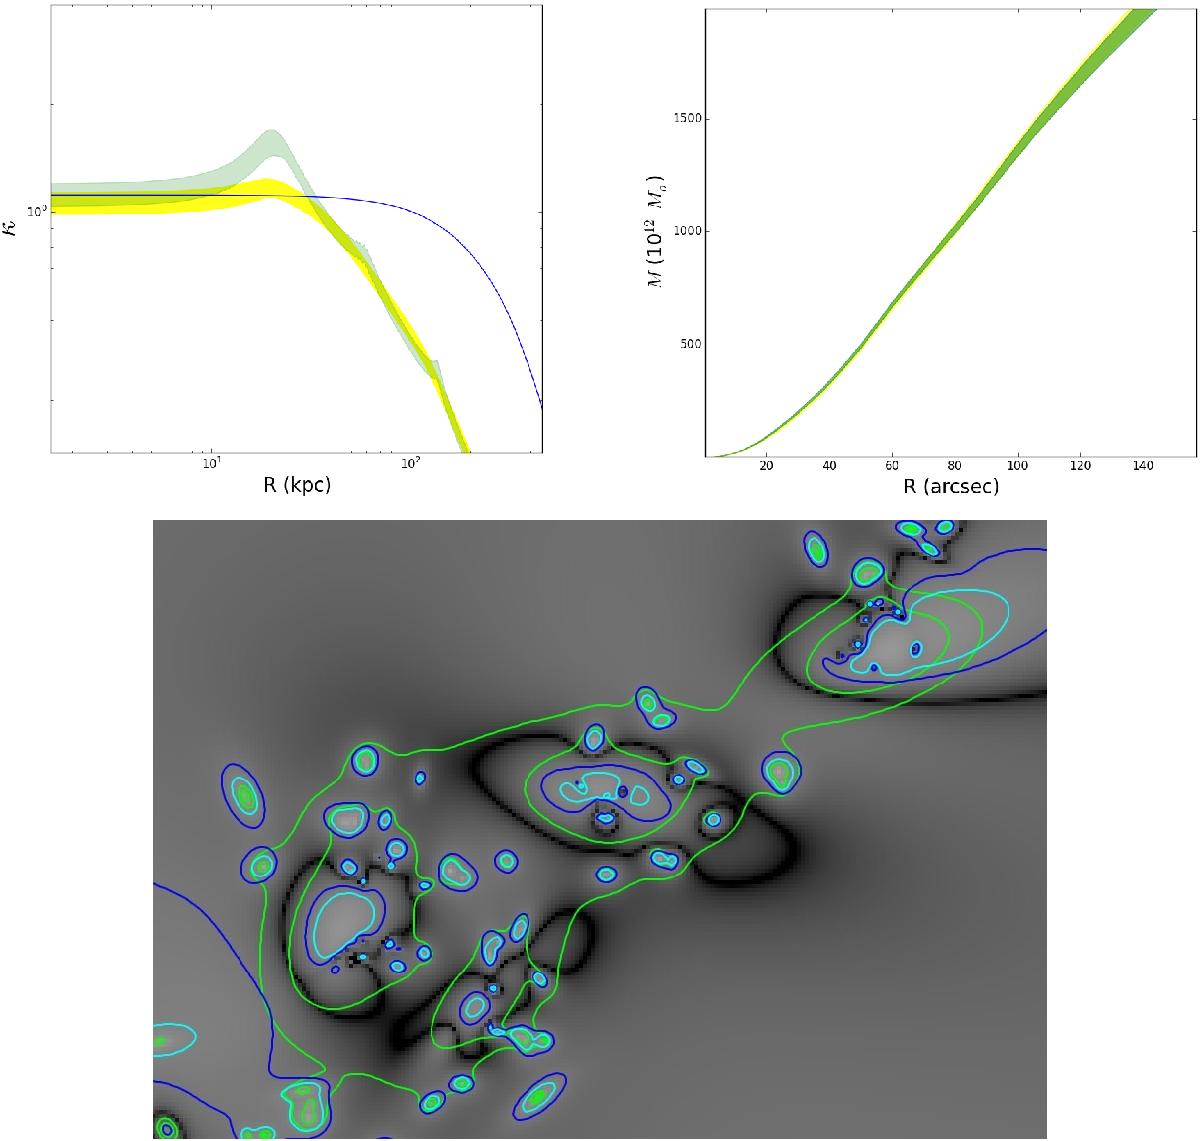
Top left: surface-mass-density profile for the smooth component of the cored (yellow) and the non-cored (green) mass model. The blue line shows the same quantity, as derived by Diego et al. (2015b). Shaded areas represent 3σ uncertainties. Top right: cumulative two-dimensional mass profile for the cored (yellow) and the non-cored (green) mass model (abscissa in arc seconds). Bottom: absolute value of the relative difference between each models. Blue contours mark where the difference is 20%, and cyan contours where it is 30%. The mass contours corresponding to the non-cored model are shown in green. The size of the field is 226″ × 155″.
Current usage metrics show cumulative count of Article Views (full-text article views including HTML views, PDF and ePub downloads, according to the available data) and Abstracts Views on Vision4Press platform.
Data correspond to usage on the plateform after 2015. The current usage metrics is available 48-96 hours after online publication and is updated daily on week days.
Initial download of the metrics may take a while.