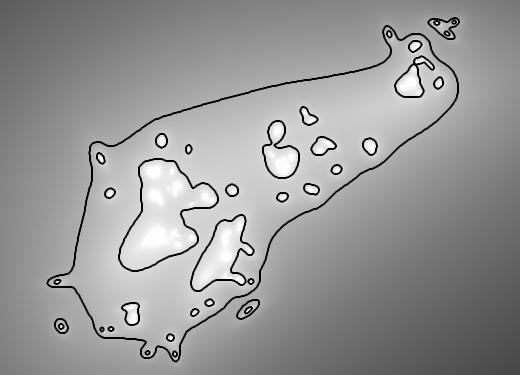
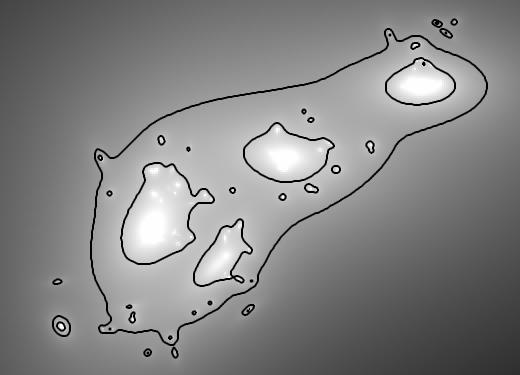
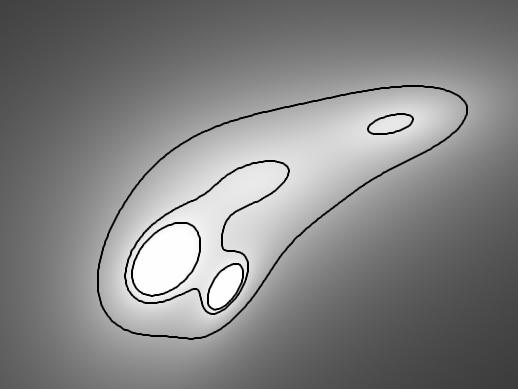
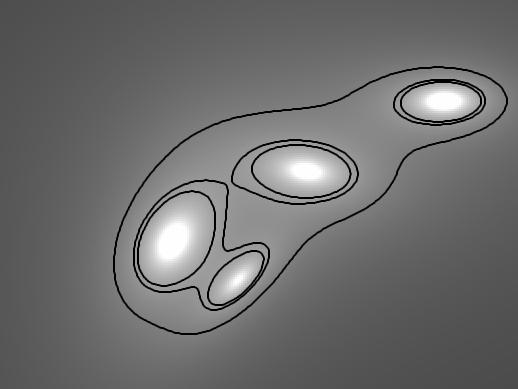
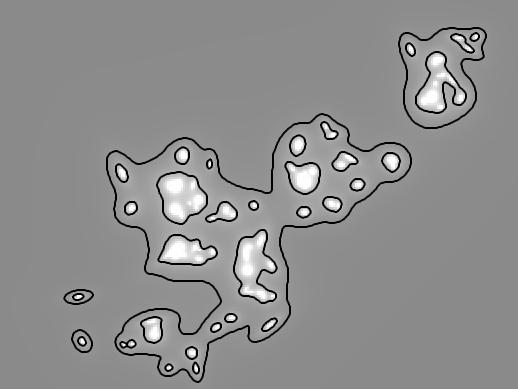
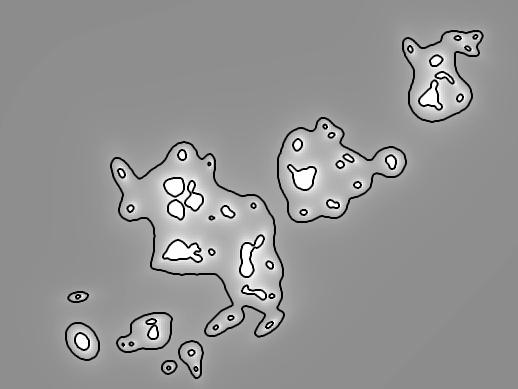
Fig. 3
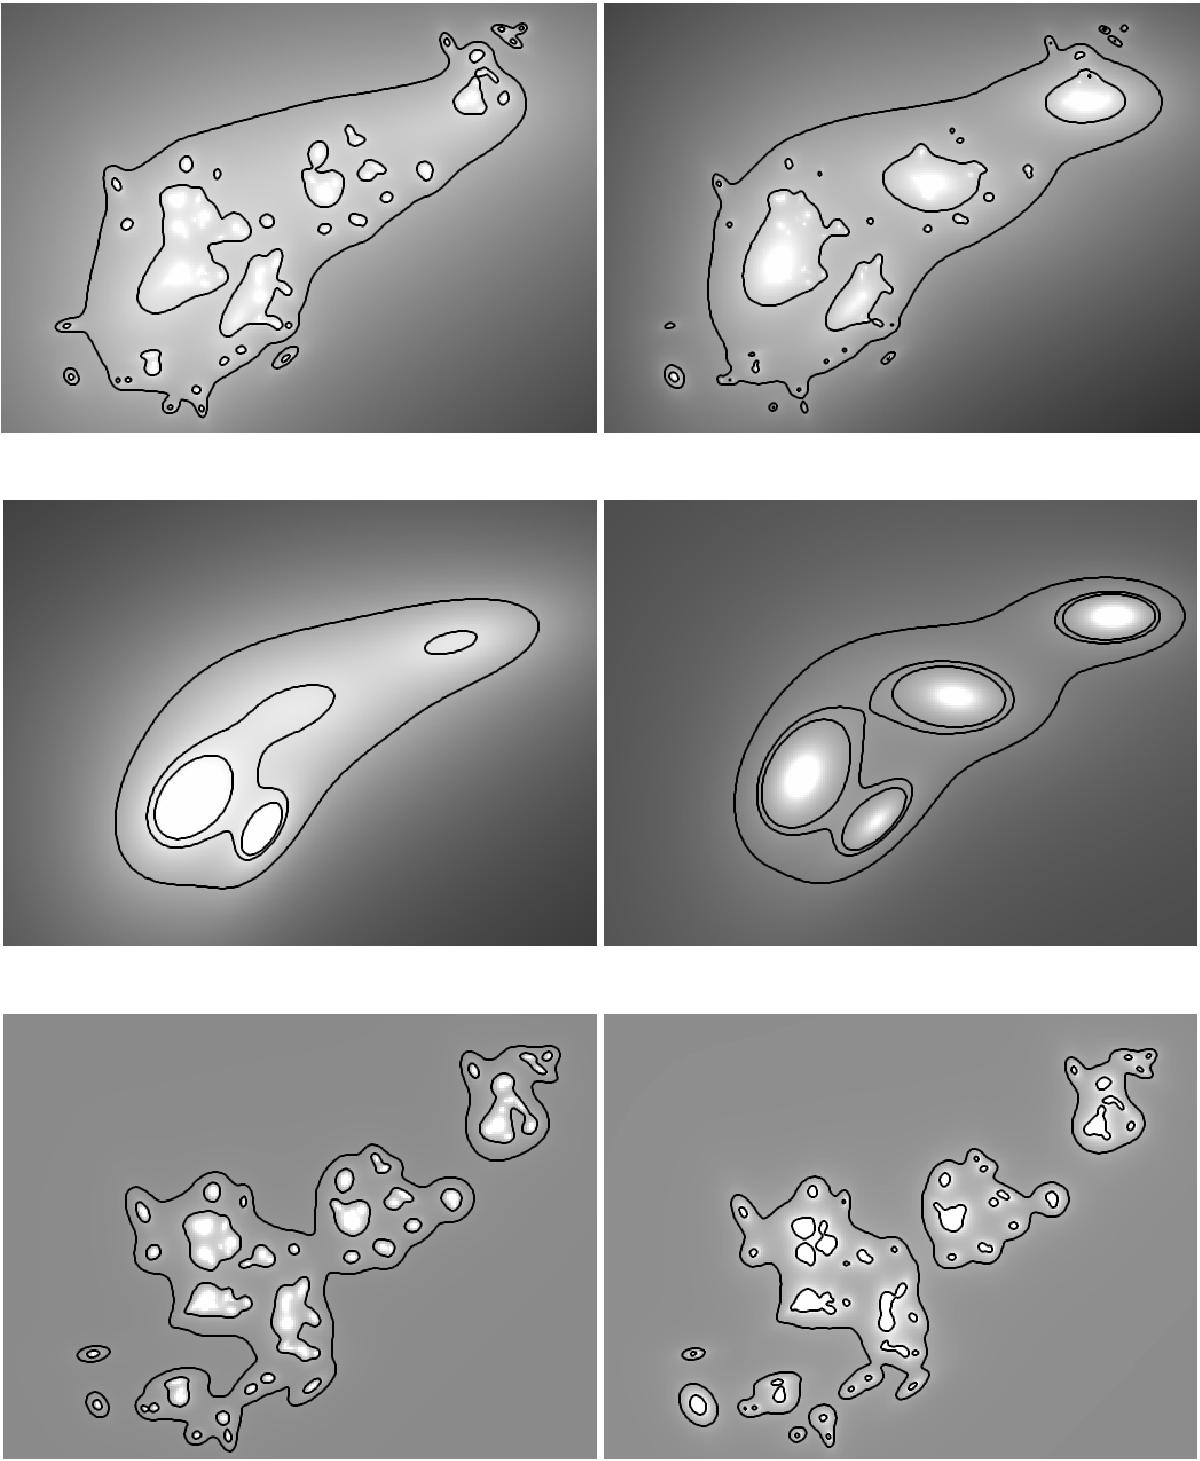
Comparison between the mass maps of the cored (left) and the non-cored (right) mass models. Top: total mass (smooth component + galaxies). Contours show where the surface mass density equals 4, 7 × 10¹⁰M⊙ arcsec-2. Middle: contribution from the smooth component only. Contours delineate where the surface mass density equals 4, 5.5, 6.0 × 10¹⁰M⊙ arcsec-2. Bottom: contribution from the galaxies component only. Contours mark where the surface mass density equals 0.5, 2 × 10¹⁰M⊙ arcsec-2. We note that the galaxies gain more weight in the cored mass model, in order to compensate for the smoothness of the underlying large-scale mass components. Each panel measures 260′′× 190′′.


Current usage metrics show cumulative count of Article Views (full-text article views including HTML views, PDF and ePub downloads, according to the available data) and Abstracts Views on Vision4Press platform.
Data correspond to usage on the plateform after 2015. The current usage metrics is available 48-96 hours after online publication and is updated daily on week days.
Initial download of the metrics may take a while.