Fig. 7
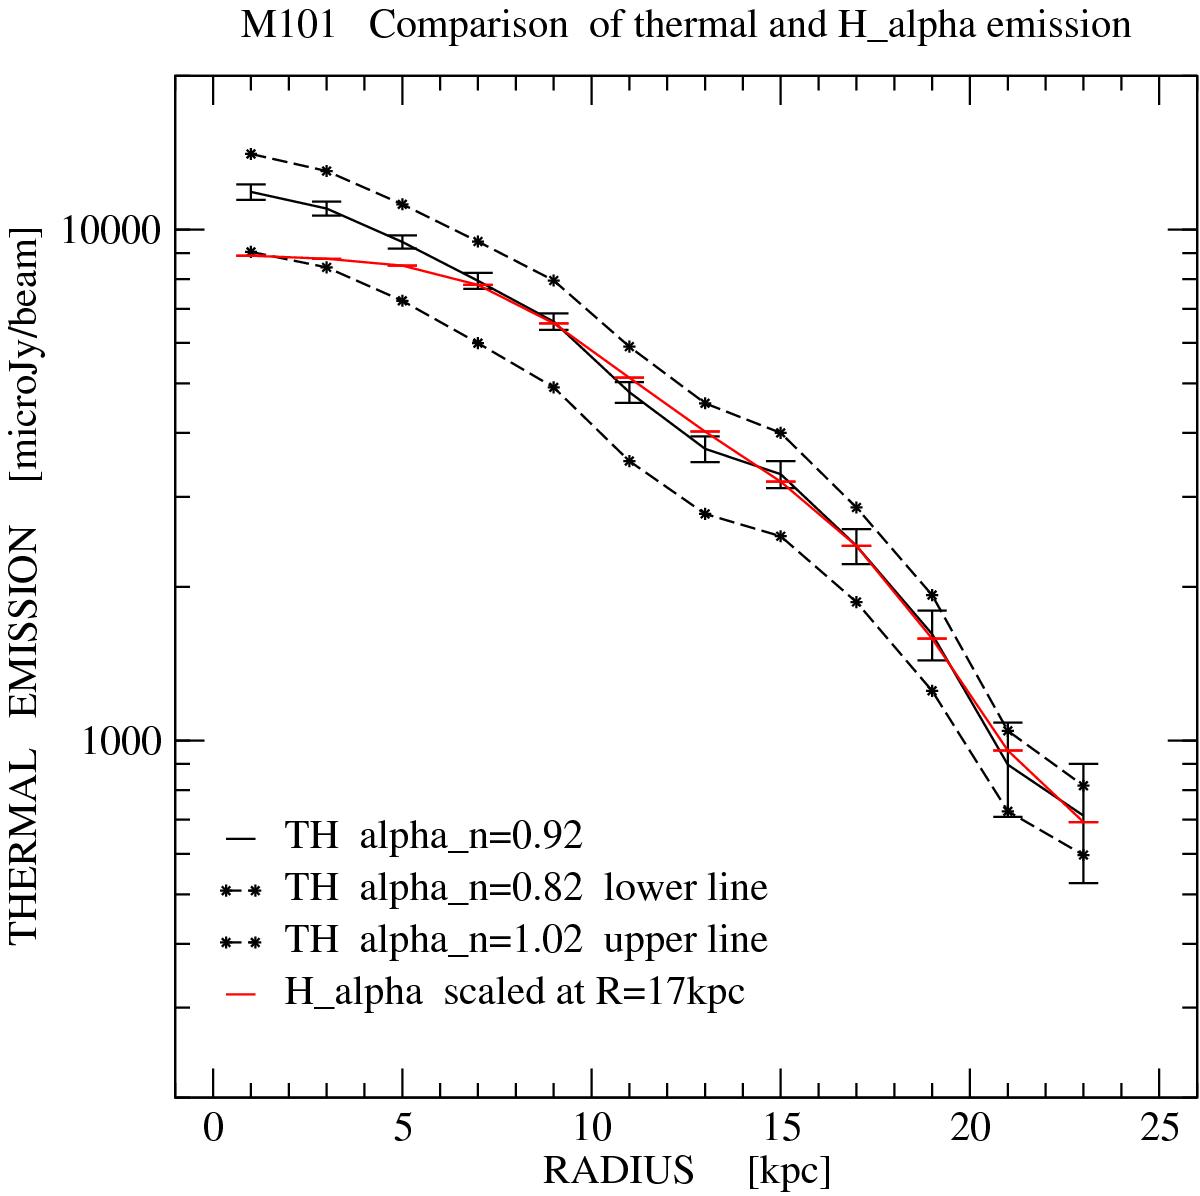
Average intensity in 2 kpc-wide radial rings in the plane of M 101 of TH derived with αn = 0.92 (solid line) and with αn= 0.82 and 1.02 (dotted lines), plotted against galacto-centric radius. The errors on the dotted lines are the same as on the solid line, but are not shown for clarity. The red line shows the radial distribution of the Hα emission (Hoopes et al. 2001), scaled to TH derived with αn = 0.92 at the ring R = 16−18 kpc. Note the close corresponcence between the two distributions at R> 6 kpc. The discrepancy in the central part may be due to extinction in Hα and a possible overestimate of TH on H ii regions.
Current usage metrics show cumulative count of Article Views (full-text article views including HTML views, PDF and ePub downloads, according to the available data) and Abstracts Views on Vision4Press platform.
Data correspond to usage on the plateform after 2015. The current usage metrics is available 48-96 hours after online publication and is updated daily on week days.
Initial download of the metrics may take a while.