Fig. 5
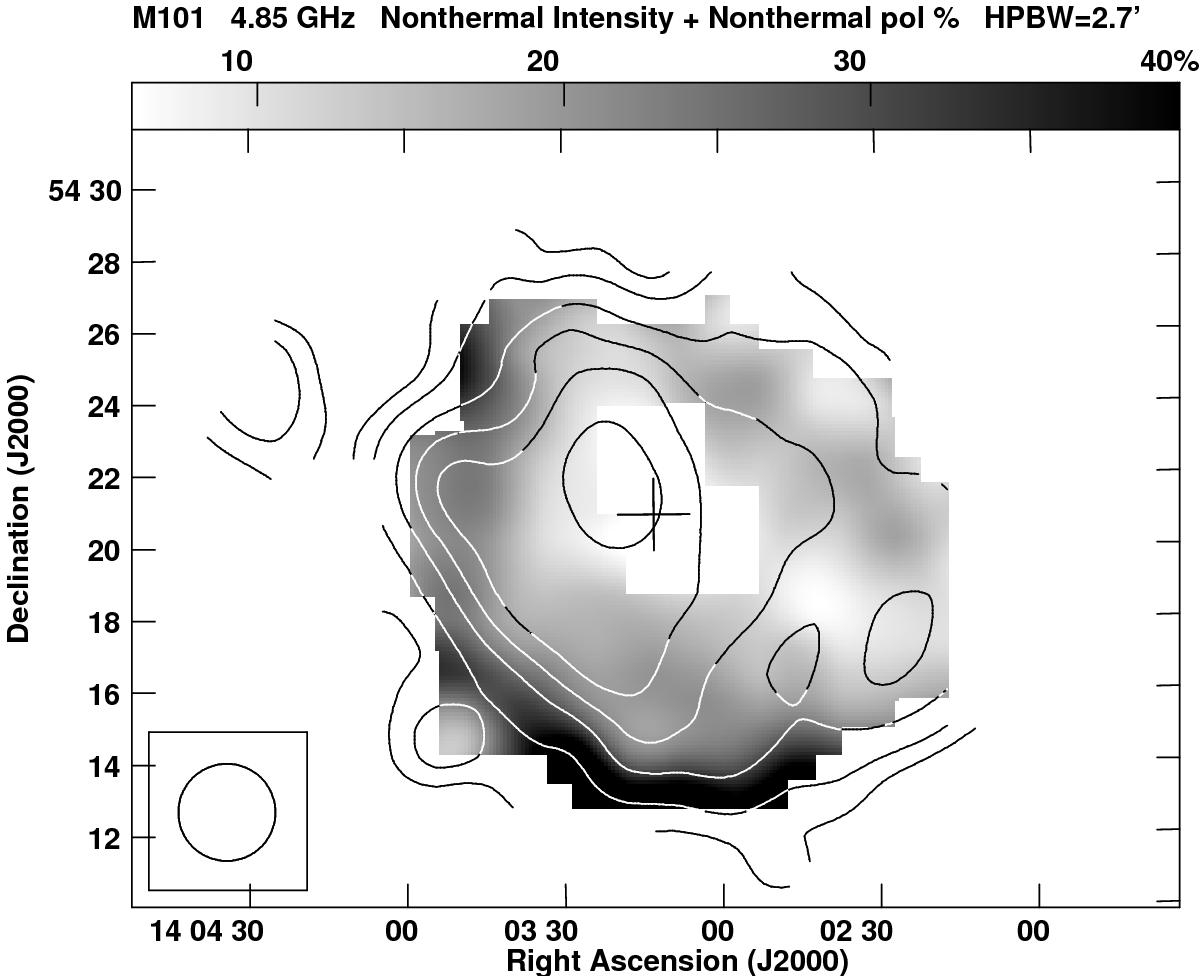
Distribution of the non-thermal emission from M 101 at λ 6.2 cm (contours) superimposed onto the non-thermal degree of polarization (greyscale). Contour levels are 1, 2, 4, 6, 8, and 12 mJy/beam area . The centre position is indicated with a plus. The maximum in the emission NE of the centre is due to the background source number 20 in the list of Israel et al. (1975). The noise level in the non-thermal intensity is about 0.5 mJy/beam area . In the centre region, strong depolarization causes very low non-thermal polarization degrees. The beamwidth is ![]() .
.
Current usage metrics show cumulative count of Article Views (full-text article views including HTML views, PDF and ePub downloads, according to the available data) and Abstracts Views on Vision4Press platform.
Data correspond to usage on the plateform after 2015. The current usage metrics is available 48-96 hours after online publication and is updated daily on week days.
Initial download of the metrics may take a while.