Fig. 1
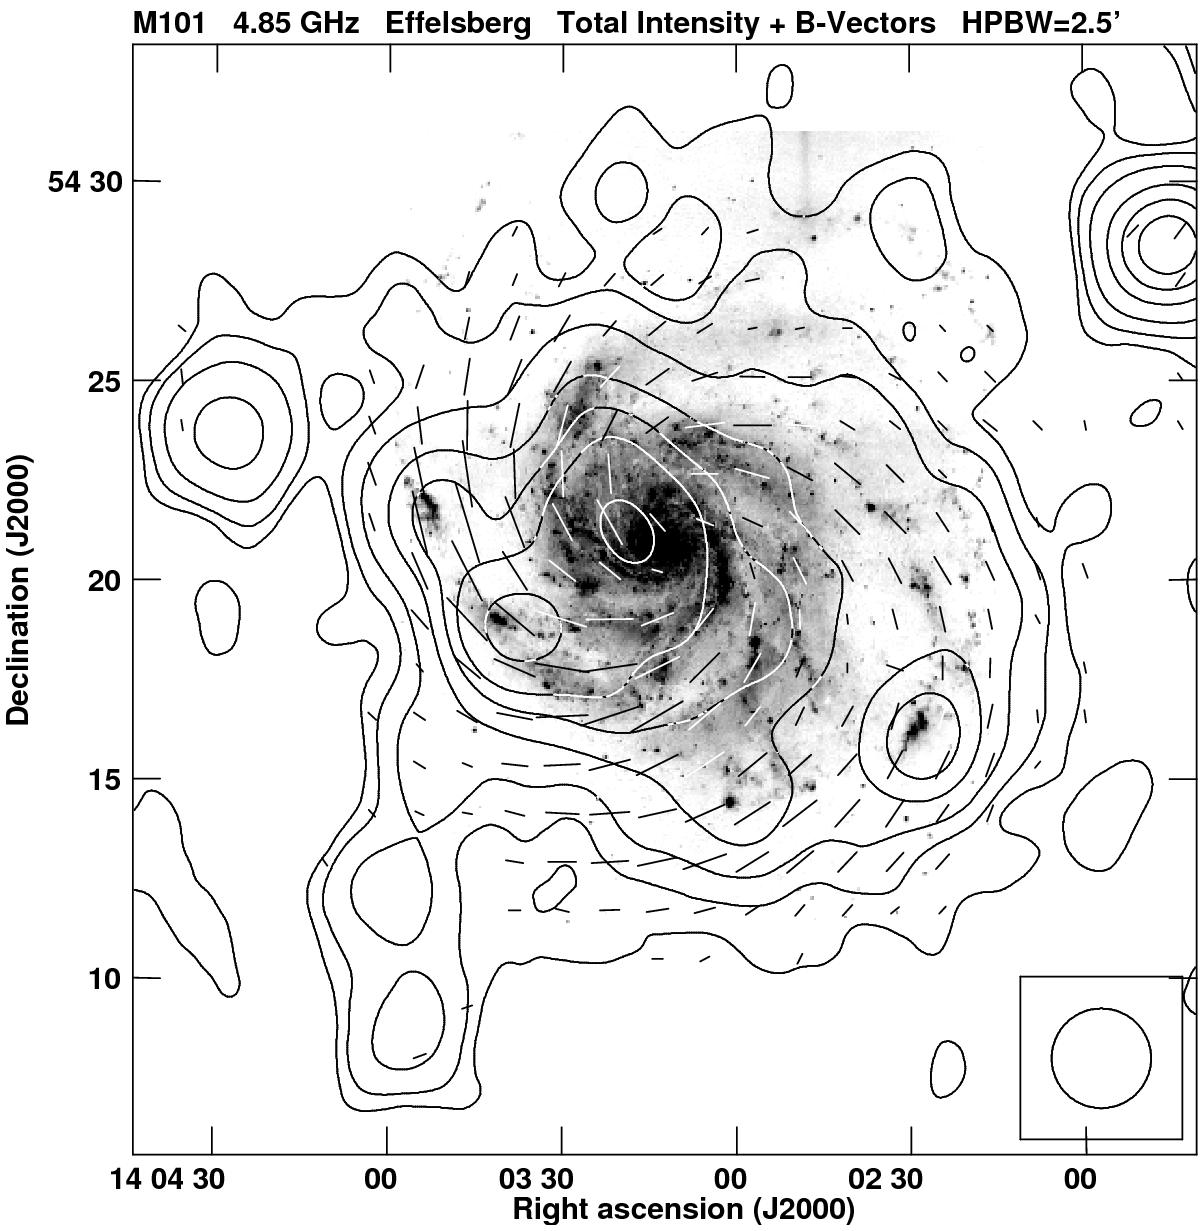
Total emission and apparent B-vectors of the polarized emission (defined as E-vectors rotated by 90°) from M 101 observed at λ 6.2 cm overlaid on the optical image of Sandage (1961). The contour levels are 1, 2, 4, 8, 12, 16, and 24 mJy/beam area . A vector of 1′ length corresponds to a polarized intensity of 1 mJy/beam area . The noise levels are 0.5 mJy/beam area in I and 0.07 mJy/beam area in PI. The beamwidth of ![]() is shown in the lower right corner. A square-root scale has been applied to the optical image to show low surface brightness structures more clearly.
is shown in the lower right corner. A square-root scale has been applied to the optical image to show low surface brightness structures more clearly.
Current usage metrics show cumulative count of Article Views (full-text article views including HTML views, PDF and ePub downloads, according to the available data) and Abstracts Views on Vision4Press platform.
Data correspond to usage on the plateform after 2015. The current usage metrics is available 48-96 hours after online publication and is updated daily on week days.
Initial download of the metrics may take a while.