Fig. 9
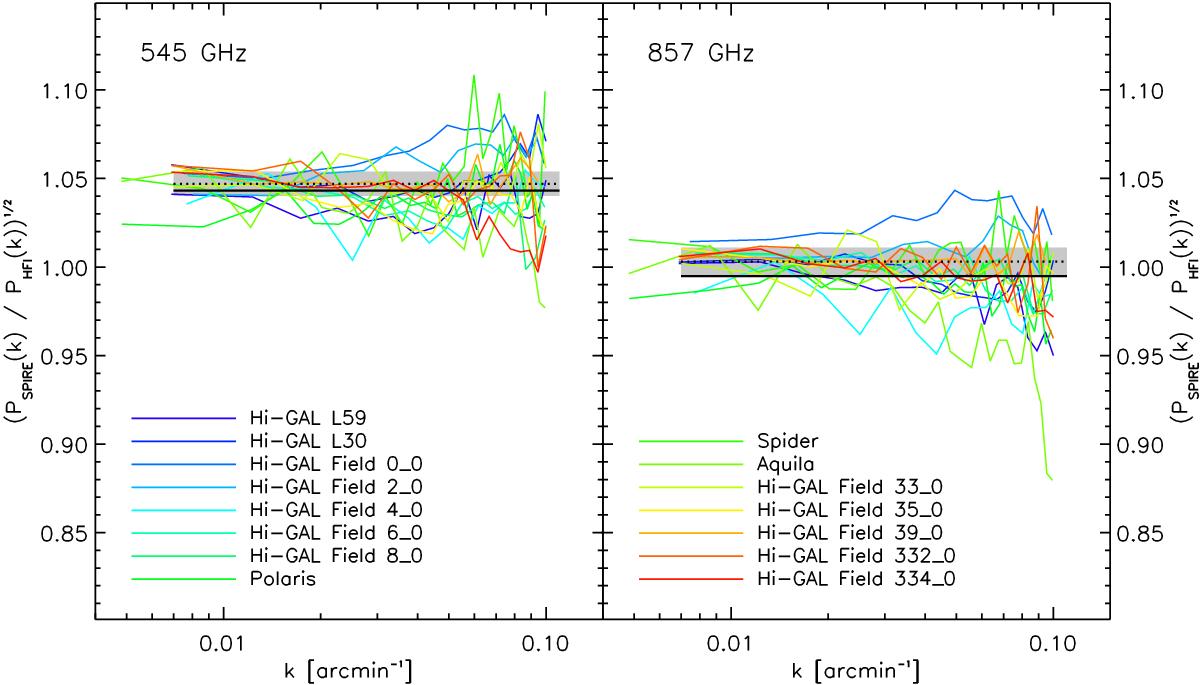
Relative gain, from the square root of the SPIRE-to-HFI power spectrum ratio, for each field at 545 GHz (left) and 857 GHz (right). The mean gain GPSD from the power spectrum analysis (solid line) is in close agreement with the mean gain GScat from pixel-to-pixel analysis (dotted line), which is well within the 1σ dispersion of the latter (shaded in grey).
Current usage metrics show cumulative count of Article Views (full-text article views including HTML views, PDF and ePub downloads, according to the available data) and Abstracts Views on Vision4Press platform.
Data correspond to usage on the plateform after 2015. The current usage metrics is available 48-96 hours after online publication and is updated daily on week days.
Initial download of the metrics may take a while.