| Issue |
A&A
Volume 588, April 2016
|
|
|---|---|---|
| Article Number | A7 | |
| Number of page(s) | 13 | |
| Section | Extragalactic astronomy | |
| DOI | https://doi.org/10.1051/0004-6361/201527181 | |
| Published online | 09 March 2016 | |
Abundance ratios of red giants in low-mass ultra-faint dwarf spheroidal galaxies
1 GEPI, Observatoire de Paris, PSL Research University, CNRS, Univ. Paris Diderot, Sorbonne Paris Cité, 61 avenue de l’Observatoire, 75014 Paris, France
e-mail: patrick.francois@obspm.fr
2 Université de Picardie Jules Verne, 33 rue St. Leu, 80000 Amiens, France
3 Departamento de Ciencias Fisicas, Universidad Andres Bello, 220 Republica, Santiago, Chile
4 Instituto de Astronomía, Universidad Católica del Norte, Av. Angamos 0610 Antofagasta, Chile
5 Department of Astronomy, Faculty of Physical and Mathematical Sciences, University of Concepción, Chile
6 Millennium Institute of Astrophysics, Pontificia Universidad Católica de Chile, 4860 Vicuña Mackenna, Macul Santiago, Chile
Received: 13 August 2015
Accepted: 11 December 2015
Context. Low-mass dwarf spheroidal galaxies are key objects for our understanding of the chemical evolution of the pristine Universe and the Local Group of galaxies. Abundance ratios in stars of these objects can be used to better understand their star formation and chemical evolution.
Aims. We report on the analysis of a sample of 11 stars belonging to five different ultra-faint dwarf spheroidal galaxies (UfDSph) that is based on X-Shooter spectra obtained at the VLT.
Methods. Medium-resolution spectra have been used to determine the detailed chemical composition of their atmosphere. We performed a standard 1D LTE analysis to compute the abundances.
Results. Considering all the stars as representative of the same population of low-mass galaxies, we found that the [α/Fe] ratios vs.s [Fe/H] decreases as the metallicity of the star increases in a way similar to that which is found for the population of stars that belong to dwarf spheroidal galaxies. The main difference is that the solar [α/Fe] is reached at a much lower metallicity for the UfDSph than for the dwarf spheroidal galaxies. We report for the first time the abundance of strontium in CVn II. The star we analyzed in this galaxy has a very high [Sr/Fe] and a very low upper limit of barium which makes it a star with an exceptionally high [Sr/Ba] ratio.
Key words: galaxies: abundances / stars: abundances / Local Group
© ESO, 2016
1. Introduction
Λ cold dark matter cosmological models are in agreement with many observable phenomena, but some discrepancies are found on small scales. In particular, this model predicts many more dark-matter sub-halos (a factor of 50) than the number of observed dwarf galaxies (Moore et al. 1999). A solution to this problem was put forward by Bullock et al. (2000) who suggested that gas accretion in low-mass halos could be suppressed by the photo-ionization mechanism during the reionization of the Universe. The observed dwarf satellites correspond to the small fraction of halos that accreted enough amounts of gas before reionization. Based on this hypothesis, Ricotti & Gnedin (2005) proposed that dwarf galaxies could be classified into three different classes, depending on the occurrence of their star formation relative to the reionization event. Dwarf galaxies that formed most of their stars prior to the reionization are classified as “true fossils”. From this classification, it appears that some of the stars we observe today in the so-called ultra-faint dwarf spheroidal galaxies (UfDSph, Belokurov et al. 2007) could be “survivors” of the reionization period. Brown et al. (2014) analyzed the star formation history of six UfDSphs (Bootes I, Canes Venatici II, Coma Berenices, Hercules, Leo IV, and Ursa Major I). They concluded that five of them are best fit by a star-formation history where at least 75% of the stars formed by z ≃ 10 and 100% of the stars formed by z ≃ 3 i.e. 11.6 Gyrs ago, supporting the hypothesis of a quenching of the star formation by a global external influence such as reionization. The detailed chemical composition of stars in ultra-faint dwarf spheroidal galaxies is therefore an important tool to probe the early evolution of the Local Group. This paper reports on the detailed abundance determination of stars belonging to the UfDSphs Bootes II, Canes Venatici I, Canes Venatici II, Hercules, and Leo IV. Among these five galaxies, only two (Leo IV and Hercules) are consistent with the hypothesis that the bulk of their stars were formed before reionization (Weisz et al. 2014). However, their conclusion has been challenged (Brown et al. 2014) . Three of our galaxies were analyzed by Brown et al. (2014). Using deep and high signal-to-noise ratio (S/N) Advance Camera for Surveys (ACS) imaging over a wide field, they found that the galaxies (and three others, among them BooI) were consistent with the hypothesis that reionization ended star formation in all of them.
Webster et al. (2015) have modeled the chemical evolution of the six UfDsph galaxies studied by Brown et al. (2014), among them Boo I, CVnI, Hercules, and LeoIV. They showed that two single-age bursts cannot explain the observed [α/Fe] versus [Fe/H] distribution in these galaxies. They suggest an alternative scenario in which star formation is continuous except for short interruptions. Their conclusion is that the extended SFR model has a higher likelihood than the two-burst model, with the only exception being Ursa Major I. These studies demonstrate that there is an active debate on the identification of UfDSph which could be considered as fossil galaxies.
Before going into the details of our analysis, we would like to remind the most important characteristics of each galaxy for which we obtained mid-resolution spectra with the ESO-VLT and the X-Shooter spectrograph.
1.1. Bootes II
The discovery of Bootes II was reported by Walsh et al. (2007) as an overdensity on the Sloan Digital Sky data release 5 ( hereafter SDSS DR5) distribution. From isochrone-fitting techniques and accurate color−magnitude diagrams, they described Bootes II as an old (12 Gyr), metal-poor ([Fe/H] ≃−2.00 dex) galaxy with a distance estimated at 60 kpc. MMT/Megacam imaging in Sloan g and r (Walsch et al. 2008) led to a revised distance of 42 ± 2 kpc. From follow-up spectroscopy of five member stars, Koch et al. (2008) found a mean metallicity of [Fe/H] = − 1.79 ± 0.05 dex. This determination relies on an old calibration of the Ca triplet, which was later revised. Koch & Rich (2014) made a detailed chemical analysis of the brightest confirmed member star in Boo II using Keck/Hires and derived a very low metallicity of [Fe/H] = −2.93 dex using an updated Ca triplet calibration. They also found a high [α/Fe] ratio that is compatible with the α-enhanced plateau value of the galactic halo.
1.2. Canes Venatici I
Canes Venatici I was discovered in 2006 by Zucker et al. (2006) as a stellar overdensity in the north Galactic cap using the SDSS DR 5. From the tip of the red giant branch, they concluded that the Galaxy was at a distance of ≃220 kpc. The first deep color−magnitude diagrams of the Canes Venatici I (CVn I) dwarf galaxy were provided by Martin et al. (2008) from observations with the wide-field Large Binocular Camera on the Large Binocular Telescope. Interestingly, their analysis revealed a dichotomy in the stellar populations of CVn I which harbors an old (≥10 Gyr), metal-poor ([Fe/H] ≃−2.0 dex), and spatially extended population along with a much younger, more metal-rich, and spatially more concentrated population. However, the claim of a young population in Canes Venatici I has not been supported by more recent studies (Ural et al. 2010; Okamoto et al. 2012). Martin et al. (2008) derived a distance modulus of (m−M)0 = 21.69 ± 0.10 or D = 218 ± 10 kpc. Okamoto et al. (2012) confirmed the distance modulus using deep images taken with the Subaru/Suprime-Cam imager, obtaining a distance modulus of (m−M)0 = 21.68 ± 0.08 (216 ± 8 kpc). Kirby et al. (2010) determine the abundances of Fe and several α elements in a sample of 171 stars using medium-resolution spectra (R ~ 7000) that was obtained with Keck/DEIMOS and found metallicities ranging from −1.0 dex to −3.3 dex. No high-resolution spectroscopy has so far been performed.
1.3. Canes Venatici II
The UfDSph Canes Venatici II is one of the four UfDSph discovered by Belokurov et al. (2007) in the Sloan Digital Sky Survey. Follow-up spectroscopic observations were performed in 2008 by Kirby et al. (2008) who analyzed 16 stars. They used DEIMOS on the Keck II telescope to obtain spectra at R ≃ 6000 over a spectra range of roughly 6500−9000 Å. They derived a mean metallicity of [Fe/H] = − 2.19 ± 0.05 dex with a dispersion of 0.58 dex. Vargas et al. (2013) computed the [α/Fe] ratios in eight stars of this galaxy and found an increase of the [α/ Fe] as metallicity decreases with a solar ratio at [Fe/H] ≃−1.30 dex to reach on average an [α/ Fe] ≃ 0.5 dex at [Fe/H] ≃−2.50 dex. The distribution of [Ca/Fe] and [Ti/Fe] abundance ratios tends to point towards the presence of a significant scatter at low [Fe/H]. The metallicity was later revised by Kirby et al. (2013) who found [Fe/H] = − 2.12 ± 0.05 dex.
1.4. Hercules
Hercules is a dwarf spheroidal satellite of the Milky Way, found at a distance of 138 kpc. This UfDSph has been discovered by Belokurov et al. (2007). Coleman et al. (2007) performed deep wide-field photometry in B, V, and r of this galaxy using the Large Binocular Telescope down to 1.5 mag below the main sequence turn-off and found that the Hercules dwarf is highly elongated, which suggests tidal disruption as a likely cause. Simon et al. (2007) obtained a first estimate of the metallicity using Keck-DEIMOS spectroscopy of 30 stars and finds [Fe/H] ≃−2.27 with a dispersion of 0.31 dex. Koch et al. (2008) analyzes two red giants and derived a metallicity of [Fe/H] ≃−2.00 dex with strong enhancements in Mg and O and a high deficiency in the neutron capture elements. Later, Adèn et al. (2011) analyzes 11 stars in Hercules and obtains a metallicity spread ranging from [Fe/H] = −2.03 to −3.17 dex. They also find that the red giant branch stars are more metal-poor than previously estimated by photometry. A comparison of their spectroscopic stellar parameters with isochrones indicates that the giants in Hercules are older than 10 Gyr. Koch et al. (2013) analyze a new sample of four red giants and confirm the high level of depletion of the neutron capture elements and suggest that the chemical evolution of Her was dominated by very massive stars. Deep g, i-band DECam stellar photometry of the Hercules Milky Way satellite galaxy, and its surrounding field, out to a radial distance of 5.4 times the tidal radius, was performed by Roderick et al. (2015). They identify nine extended stellar substructures associated with the dwarf, preferentially distributed along the major axis of the galaxy, which demonstrates that Hercules is a strongly tidally-disrupted system.
1.5. Leo IV
The dwarf galaxy Leo IV was discovered by Belokurov et al. (2007) along with Coma Berenices, Canes Venatici II, and Hercules. Simon et al. (2007) obtain Keck/DEIMOS spectra of a sample of stars belonging to this galaxy and derive a metallicity of [Fe/H] = − 2.31 ± 0.10 dex. Adopting a reddening E(B−V) = 0.04 ± 0.01 mag and a metallicity of [Fe/H] = − 2.31 ± 0.10 dex. Moretti et al. (2009) derive a distance of 154 ± 5 kpc. The first determination of the chemical composition of stars in Leo IV was done by Simon et al. (2010). They obtain high resolution Magellan/MIKE spectra of the brightest star in Leo IV and measure an iron abundance [Fe/H] = −3.2 dex with an α element enhancement similar to what is found in the Milky Way halo. Interestingly, this star is among the most metal-poor stars found in UfDSphs. Okamoto et al. (2012) estimate the average age of the stellar population to be 13.7 Gyr by overlaying Padova isochrones. Kirby et al. (2013) revise the metallicity and find [Fe/H] = − 2.45 ± 0.07 dex. We present in this paper the determination of the detailed chemical composition of two stars that belong to LeoIV.
2. Observations
The aim of these observations was the study of the metal-poor population of stars belonging to UfDSphs. Therefore the sample is biased towards the brightest targets among the metal-poor sample of these galaxies. Target stars were selected from among the most metal-poor radial velocity member stars with V< 20.0 in each galaxy, and were extracted from published low-resolution studies (Kirby et al. 2008; Koch et al. 2009). All of the targets have putative metallicities [Fe/H] <−2.0 dex, nine out of 11 having [Fe / H] < −2.6 dex, i.e., more metal-poor than any galactic globular cluster. From their CaT index, seven stars have [Fe/H] <−3.0 dex and are, therefore, extremely metal-poor.
The observations were performed in service mode with the ESO-Kueyen telescope (VLT UT2) and the high-efficiency spectrograph X-Shooter (D’Odorico et al. 2006; Vernet et al. 2011). The list of targets is given in Table A.1.
The observations have been performed in staring mode with 1x1 binning and the integral field unit (IFU). We used the IFU as a slicer with three 0.6″ slices. This corresponds to a resolving power of R = 7900 in the ultraviolet arm (UVB) and R = 12 600 in the visible arm (VIS). The stellar light is divided into three arms by X-Shooter; we only analyzed the UVB and VIS spectra. The stars we observed are very faint and have most of their flux is in the blue part of the spectrum, so that the signal-to-noise ratio (S/N) of the infra-red spectra is too low to allow a reliable chemical abundance analysis. Moreover, the sky contamination in staring mode strongly affects the stellar spectrum. The spectra were reduced using the X-Shooter pipeline (Goldoni et al. 2006), which performs the bias and background subtraction, cosmic-ray-hit removal (Van Dokkum 2001), sky subtraction (Kelson 2003), flat-fielding, order extraction, and merging. However, the spectra were not reduced using the IFU pipeline recipes. Each of the three slices of the spectra were, instead, reduced separately in slit mode with a manual localization of the source and the sky. This method allowed us to perform the best possible extraction of the spectra, leading to an efficient cleaning of the remaining cosmic ray hits, and also to a noticeable improvement in the S/N, thanks to the optimal extraction pipeline routine of X-Shooter. Using the IFU can cause some problems with the sky subtraction because there is only ±1″ on both sides of the object. In the case of a large gradient in the spectral flux (caused by emission lines), the modeling of the sky-background signal can be of poor quality owing to the small number of points used in the modeling. As we made our analysis only in the UVB and VIS spectra of X-Shooter, only a few lines are affected by this problem.
We used the strong lines of magnesium to determine the radial velocities of the stars using the cross-correlation of the synthetic spectrum with the observed spectrum. Heliocentric corrections have been also applied. The radial velocities of the stars are reported in Table A.1. Typical errors of 5 km s-1 have been estimated by computing the dispersion of the measurements of the radial velocities on the individual spectra before combining them for the abundance determination. The results are in good agreement with the systemic radial velocities of the parent galaxies.
3. Analysis
The effective temperature was derived from the (g−i) colors (Koch et al. 2009) for the two Bootes stars and the V and IC colors taken from Kirby et al. (2008) for the remaining stars. Using the relation given by Jordi et al.(2006), (g−i) have been transformed into (V−IC) using the relation given by Jordi et al. (2006). The reddening correction is from Schlegel et al. (1998). We adopted the calibration of Ramírez & Meléndez (2005), the use of the Alonso et al. (1999) calibration would result in temperatures that are 100 K to 150 K hotter. We note that all the published color calibrations are ill defined for very metal-poor giants, owing to a scarcity of calibrators. The Ramírez & Meléndez (2005) sample of calibrators has more metal-poor giants than the Alonso et al. (1999) sample, hence our choice. The surface gravities have been obtained from the photometry and calculated using the standard relation between log g, mass, Teff, and Mbol relative to the Sun, assuming the solar values Teff, ⊙ = 5790 K, log g = 4.44, and Mbol = 4.72. We assumed also 0.8 M⊙ for the mass of the giant stars that have been observed. Distance moduli have been taken from Walsch et al. (2008) for BooII, from Kuehn et al. (2008) for CVnI, from Greco et al. (2008) for CVnII, from Musella et al. (2012) for Her, and from Moretti et al. (2009) for LeoIV.
We carried out a classical 1D LTE analysis using OSMARCS model atmospheres (Gustafsson et al. 1975, 2003, 2008; Plez et al. 1992; Edvardsson et al. 1993; Asplund et al. 1997). The abundances used in the model atmospheres were solar-scaled with respect to the Grevesse & Sauval (2000) solar abundances, except for the α elements that are enhanced by 0.4 dex. We corrected the resulting abundances by taking into account the difference between Grevesse & Sauval (2000) and Caffau et al. (2011b), Lodders et al. (2009) solar abundances.
The abundance analysis was performed using the LTE spectral line analysis code turbospectrum (Alvarez & Plez 1998; Plez 2012), which treats scattering in detail. The carbon abundance was determined by fitting the CH band near to 430 nm (G band). The molecular data that correspond to the CH band are described in Hill et al. (2002) and Plez et al.(2008).
Two stars (HD 165195 and HE1249-3121) with published detailed abundances (Gratton et al. 1994; Allen et al. 2012) obtained using high resolution spectra have been used to check the validity of our abundance determinations. For these two stars, we retrieved X-shooter spectra and recomputed the abundances of the elements measured in our sample of UDSph galaxy stars. Our results are in agreement within 0.1 dex with the published abundances. The adopted stellar parameters can be found in Table A.3.
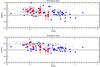 |
Fig. 1 Alpha elements: gray circles represent literature data for field stars from Roederer et al. (2014). Blue triangles are literature data for dwarf spheroidal galaxies in Frebel (2010) who collected results from (Shetrone et al. 2001, 2003; Cohen & Huang 2004; Fulbright et al. 2004; Geisler et al. 2005; Aoki et al. 2009; Frebel et al. 2010a,b; Simon et al. 2010) Red circles represent the results for our sample of UfDSph stars. |
We measured the equivalent widths for a list of Fe i lines given in Table A.4. With the assumed stellar parameters, we first checked the micro turbulent velocity using the method of the curves of growth as in Lemasle et al. (2008).
We checked the excitation temperature and refined the determination of the micro turbulent velocity parameters using the standard trends abundance vs. excitation temperature and abundance vs. equivalent width. The iron excitation is satisfied for our adopted temperatures. It is standard practice to determine the gravity by imposing ionization balance on the Fe i and Fe ii lines. Unfortunately, with the relatively low S/N and the moderate resolution of our spectra, very few Fe ii lines were detectable, and they are all either weak features and/or in low S/N regions of the spectrum. We therefore did not take these Fe ii lines into account and determined the gravity from the photometry, as explained above.
For all the lines belonging to the elements other than Fe, we used the spectrum synthesis to determine the abundances.
4. Error budget
Table A.5 lists an estimate of the errors that are due to typical uncertainties in the stellar parameters. These errors were estimated by varying Teff, log g, and ξ in the model atmosphere of SDSS J163114.06 +124526.6 by the amounts indicated in the table. As all the stars of the sample have similar stellar parameters, the other stars yield similar results. The total error is estimated by adding the quadratic sum of the the uncertainties in the stellar parameters and the error in the fitting procedure of the synthetic spectrum and the observed spectrum (the main source of error comes from the incertitude in the placement of the continuum level).
5. Results and discussion
The resulting abundances can be found in Table A.6. Figure 1 presents the [Mg/Fe] and [Ca/Fe] ratios found for our sample together with literature data for Milky Way field stars and stars in dwarf spheroidal galaxies. The majority of the stars show a high [Mg/Fe] ratio comparable to what is found in the halo stars. The [Ca/Fe] ranges from ≃− 0.05 dex for a star in CVn I stars to ≃+0.65 dex for BooII stars. This range is in agreement with the spread found for DSph stars, in the metallicity range −2.00 to −3.00 dex. It is interesting to note that the [Mg/Fe] and [Ca/Fe] ratios reach a solar value at a metallicity lower than the Milky Way field stars (where it is reached at [Fe/H] ≃ 0.0 dex) and lower than the dwarf galaxy stars for which the solar ratio is reached at a metallicity of around −2.00 to −1.50 dex, which is in agreement with models of galactic chemical evolution (Vincenzo et al. 2014).
The upper part of Fig. 2 shows our results for the [Al/Fe] ratios. As for the previous figure, we have added literature data for field stars and dwarf spheroidal galaxy stars. We find a high value of the [Al/Fe] ratio when compared to the halo stars. We did not apply non-LTE corrections to make a direct comparison with the halo and DSph stars, which have been analyzed under the same assumptions. Sodium does not seem to share the behavior, as shown in the lower part of Fig. 2. The values of [Na/Fe] tend to be below the median value of [Na/Fe] in halo stars of the same metallicity.
Figure 3 presents the [Sr/Fe] and [Ba/Fe] ratios found for our sample together with literature data for field stars and dwarf spheroidal galaxy stars. The upper graph shows a high value of the [Sr/Fe] ratio for the metal-rich sample of our stars, similar to what is found in the halo stars and significantly different from the DSph stars. For most of the metal-poor stars of our analysis, the ratio appears to be lower that what found for the bulk of the field halo stars of the same metallicity. For Barium, our results also fall in to the range of [Ba/Fe] that is found for halo stars.
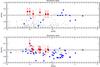 |
Fig. 2 Al and Na abundance ratios: gray circles represent literature data for field stars from Roederer et al. (2014). Blue triangles are literature data for dwarf spheroidal galaxies gathered in Frebel (2010) (see details in Fig. 2). Red circles represent the results for our sample of UfDSph stars. |
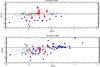 |
Fig. 3 Neutron capture elements: Gray circles represent literature data for field stars from Roederer et al. (2014). Blue triangles are literature data for dwarf spheroidal galaxies gathered in Frebel (2010, see details in Fig. 2). Red circles represent the results for our sample of UfDSph stars. Red triangles represent upper limits for stars of our sample. |
5.1. Bootes II
We have observed two stars in the Galaxy (BooII-7 and BooII-15) and found metallicities [Fe/H] = −2.98 dex and −3.08 dex. As the second star has been already observed by Koch & Rich (2014), we put the results from both studies into Table A.7. The results are in general good agreement. The carbon abundance has been computed by fitting a synthetic spectrum for the CH G band The [α/ Fe] overabundance and the low [Ba/Fe] are characteristic of the galactic halo population. We found a very low upper limit for strontium with a value of [Sr/Fe] ≤−2.22 dex. We also obtained a comparable low value of strontium for the star Boo-7 with [Sr/Fe] ≤−1.32 dex. This low value of strontium, with respect to what is found in the halo stars of the same metallicity, is generally observed in UfDSph galaxies, as shown in Fig. 3.
5.2. Canes Venatici I
Abundances of Fe, Mg, and Ca of a sample of stars belonging to CVnI have been reported by Kirby et al. (2010) using low resolution spectra. Using the same Keck/DEIMOS medium-resolution spectra that were obtained by Kirby et al. (2010), Vargas et al. (2013) to determine the abundance of Fe, Mg, Ca in stars of this galaxy. In Fig. 4, we plotted our results together with the results of Kirby et al. (2010) and Vargas et al. (2013). We have also added the results for a sample of UfDSph galaxies, as in Fig. 1.
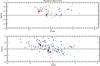 |
Fig. 4 Abundance results for the CVnI galaxy stars. Red circle represent our two stars. Green symbols are results from Kirby et al. (2010). Blue symbols are results from Vargas et al. (2013). |
 |
Fig. 5 Abundance results for the CVnII galaxy stars. Red circles represent the abundance results for our stars. Gray circles represent literature data for field stars from Roederer et al. (2014). |
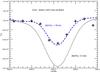 |
Fig. 6 Comparison of the observed spectrum represented by pluses and synthetic spectra with different barium abundances. |
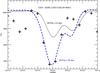 |
Fig. 7 Comparison of the observed spectrum represented by pluses and synthetic spectra with different strontium abundances. |
For the first time, we report the abundance determination of the neutron capture elements in two stars of this galaxy. We found for both stars a high ratio of [Sr/Ba], +0.22 dex, and +0.76 dex, respectively. It is interesting to note that the these ratios are similar to the ones found in the halo stars at the same [Ba/H] abundance as was found by François et al. (2007).
5.3. Canes Venatici II
Our results for Canes Venatici II are presented in Fig. 5. This is the first Strontium abundance determination for a star in this Galaxy. Our star has very high [Sr/Fe] values and and a low upper limit of [Ba/Fe], which makes it a star with an exceptionally high [Sr/Ba] – with a value larger than 2.6 dex.
Figures 6 and 7 show the results from the spectrum synthesis computation that was superimposed on the data for the line of Barium at 493.4 nm and the line of strontium at 421.5 nm. The blue lines correspond to the abundance ratios we determined, whereas the black dotted line represents a spectrum with a solar ratio. The low barium abundance was confirmed using the lines at 649.7 and 614.1 nm. The high [Sr/Ba] ratio may be explained by invoking different sources for the production of light neutron capture elements versus heavier neutron capture elements. At low metallicity, strontium may be formed by the weak r-process (Wanajo 2013). The large difference between the two mostly s-process elements, strontium and barium, may come from a peculiar pollution of the cloud that formed the star, the source possibly being a core-collapse supernova as proposed by Wanajo (2013). More recently, Cescutti et al. (2015) have computed detailed models of the galactic chemical evolution of our Galaxy. Their computations have shown that the combination of r-process production by neutron star mergers and s-process by spinstars (Pignatari et al. 2008; Frischknecht et al. 2012) is able to reproduce the large range of [Sr/Ba] ratios at low metallicity.
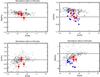 |
Fig. 8 Our results for Hercules are presented as red circles. We have added the results from Koch et al. (2008, 2013) as blue triangles (triangles pointing down are upper limits) and Adèn et al. (2011) as blue pluses. Gray dots are literature data for the field halo stars from Roederer et al. (2014). |
It would be particularly interesting to obtain a high-resolution high S/N spectrum of this star to detect and measure the abundances of other n-capture elements and compare then with high Sr low-metallicity field halo stars.
5.4. Hercules
Koch et al. (2013) studied a sample of 11 red giant stars. They could detect the barium line at 6141.713 Å for three of them. Our results for Hercules are presented as red circles in Fig. 8. We have added the results of Koch et al. (2008, 2013) and Adèn et al. (2011).
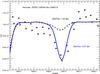 |
Fig. 9 Comparison of the observed spectrum represented by pluses and synthetic spectra. The dashed black line is computed for a barium abundance [Ba/Fe] = −1.50 dex, which correspond to the 3σ upper limit of Koch et al. (2013). The higher quality of the X-Shooter spectra permits the detection of the barium line. The blue line is computed with a barium value [Ba/Fe] = −0.87 dex corresponding to our result. |
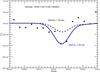 |
Fig. 10 Comparison of the observed spectrum represented by pluses and synthetic spectra. The dashed black line is computed for a barium abundance [Ba/Fe] = −1.50 dex, which corresponds to the 3σ upper limit of Koch et al. (2013). The higher quality of the X-Shooter spectra permits the detection of the barium line. The blue line is computed with a barium value [Ba/Fe] = −0.81 dex, which corresponds to our result. |
Our sample has metallicities that range from −2.28 dex to −2.83 dex. Our results clearly show an increase of the [α/Fe] ratios as the metallicity decreases. It is important to note that this effect has already been observed by Vargas et al. (2013) in not only Hercules, but also in other galaxies. This is what is expected with classical models of chemical evolution where the impact of the contribution of type SNIa iron on the abundance ratios [α/Fe] vs. metallicity relations is shown as a decrease of this ratio as the metallicity increases. For Her, the solar ratio is reached at a much lower metallicity than the one found for the Milky Way or even for the dwarf spheroidal galaxies such as Carina or Sculptor, as shown in Vincenzo et al. (2014). Our results for Calcium are in good agreement with the results of Adèn et al. (2011), although we notice a slightly higher [Ca/Fe] ratio than the one found by Koch et al. (2008, 2013) .
In Figs. 9 and 10, we show the spectrum synthesis of a barium line with two assumptions for the [Ba/Fe] ratio. The high efficiency of X-Shooter allowed us to make a clear detection of the barium line compared to previous studies, where only upper limits could be derived.
For barium, the combination of our results with the barium detections of Koch et al. (2008, 2013) seem to indicate an increase of the [Ba/Fe] ratio since the metallicity increases in line with what is found in our Galaxy. However, this needs to be taken with caution when we add their Ba upper limits since it would reveal quite a large scatter.
5.5. Leo IV
We observed two stars in Leo IV, one of which has been already studied by Simon et al. (2010). In Table A.8, we compare the results from both studies. The results are in good agreement. The high resolution spectrum used by Simon et al. (2010) allowed the abundance of Ba and Sr to be derived. For our second star, we found a higher metallicity with [Fe/H] = −2.18 dex, [Mg/Fe] = −0.06 dex and [Ca/Fe] = −0.05 dex, which is in good agreement with the theoretical predictions from the galactic chemical evolution models of Vincenzo et al. (2014).
5.6. Do all UfDSph galaxies have similar abundance ratios?
Among the fives galaxies studied in this paper, it has been suggested that two (Her and Leo IV) formed the bulk of their stars before reionization (Weisz et al. 2014). Although this hypothesis remains controversial, it would therefore be particularly interesting to check whether the abundance ratios reveal any systematic difference between these two galaxies and the rest of the sample. We have added the results from BooI (Gilmore et al. 2013) to increase the data sample.
In Fig. 11, we plotted our results and literature data for UfDSph with red symbols for Her and Leo IV, and blue symbols for the other galaxies. We also added data for the field halo stars, shown as small grey circles, as reference literature. An inspection of the figure seems to indicate these two galaxies have a lower [Ca/Fe] than the other galaxies and that [Mg/Fe] is also somewhat lower.
In Fig. 12, we made similar plots for the neutron capture elements Sr and Ba. As we have only Sr and Ba upper limits for Leo IV, this plot includes only the results for Her. Hercules seems to have lower [Sr/Fe] and [Ba/Fe] than the other galaxies. This figure clearly reveals that the abundance ratios of neutron capture elements Sr and Ba are lower than those found for the rest of the sample.
The results from Figs. 11 and 12 seem to indicate that these two galaxies share a common chemical history, which is different from the other galaxies. Was the SFR lower in these two galaxies than in the other galaxies? Did the SFR history stop at the epoch of reionization (quenching by reionization) for these two galaxies and not for the others, as suggested by Weisz et al. (2014)? The recent study from Webster et al. (2015) does not support the hypothesis that these galaxies experienced quenching by reionization. A different conclusion was obtained for Hercules by Vincenzo et al. (2014), who computed detailed models of galactic chemical evolution to probe quenched and non-quenched star-formation histories. For Hercules, they suggested a single SFR burst with a duration of 1 Gyr. A totally opposite conclusion from Webster et al. (2015) was reached by Brown et al. (2014) who support the hypothesis that the star formation was suppressed in all the UfDSph, because of a global event such as reionization of the Universe. If the hypothesis of Brown et al. (2014) is correct, another interpretation of our results could be that all these galaxies are fossil galaxies with differences in their star-formation history leading to differences in the relations [X/Fe] versus [Fe/H]. However, given the baryonic mass of these galaxies, the upper end of the IMF was probably made of a small stochastic sample of massives stars and differences in the supernovae that occurred in these galaxies. This may be a better explanation for the observed abundance differences.
It is clear that new observations are urgently required to understand the history of these galaxies.
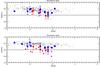 |
Fig. 11 Our results for Hercules and Leo IV are presented as a red circle. We have added the results from Koch et al. (2008, 2013) and Adèn et al. (2011) as red triangles. Blue circles represent our results for the remaining galaxies. Blue squares represent literature data for BooI. We did not include the results with upper limits only. Gray dots are literature data for the field halo stars from Roederer et al. (2014). |
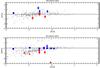 |
Fig. 12 Our results for Hercules are presented as red circle. We have added the results from Koch et al. (2008, 2013) and Adèn et al. (2011) as red triangles. Blue circles are our results for the remaining galaxies. Blue squares are literature data for BooI. We did not include the results with upper limits only. Grey dots are literature data for the field halo stars from Roederer et al. (2014). |
6. Conclusions
We have reported abundance ratios in a sample of 11 stars belonging to five different UfDSphs that are based on X-Shooter spectra obtained at the VLT. This study demonstrates that X-Shooter is a very powerful instrument to determine the detailed chemical composition of metal-poor stars in UfDSph. With the present analysis, based on only a couple of nights of telescope time, we were able to obtain some interesting results. We can therefore foresee further studies of the detailed chemical evolution of many galaxies of the Local Group using 10-m class telescopes and medium-resolution spectroscopy at the level of R ≃ 8000 and higher. From the comparative analysis of the abundances ratios found in these different systems, we can not only study the star formation histories of these galaxies as entities, but we can also check for the universality of the nucleosynthesis of the elements. In particular, UfDsph (low-mass galaxies) are ideal for studying the existence and the frequency of rare events like neutron star mergers and their impact on nucleosynthesis and galactic chemical evolution.
Considering all the stars as representative of the same population of low-mass galaxies, we found that the [α/Fe] ratios vs. [Fe/H] decrease as the metallicity of the stars increases in a way similar to that found for the population of stars that belongs to dwarf spheroidal galaxies. The main difference is that a solar [α/Fe] is reached at a much lower metallicity for the UfDSph than for the dwarf spheroidal galaxies. [Al/Fe] seems to give higher values compared to the stars with the same metallicity that were observed in the halo or in dwarf spheroidal galaxies, whereas [Na/Fe] values tend to be lower than the median halo values.
We report for the first time the abundance of Strontium in CVnII. The star we analyzed in this galaxy has a very high [Sr/Fe] and a very low upper limit of barium, which makes it a star with an exceptionally high [Sr/Ba] ratio.
We found that Hercules and Leo IV have lower [X/Fe] ratios than the other galaxies of the same metallicity, which indicates differences in the star-formation history. This difference could be related to quenching, as suggested by the work of Vincenzo et al. (2014) and Weisz et al. (2014). However, this separation into two groups of galaxies is not supported by the work of Brown et al. (2014) who suggest that star formation in all of the UfDSph was suppressed by a global outside influence and, therefore, the opposite point of view by Webster et al. (2015) who favor an extended star-formation history for the UfdSph galaxies. An alternative interpretation of our results could be that all these galaxies are fossil galaxies with differences in their star-formation history that has led to differences in the relations [X/Fe] versus [Fe/H]. However, the differences found in the supernovae that enriched these galaxies may be a better explanation for the observed abundance differences.
Acknowledgments
We would like to thank the anonymous referee for his comments that helped to improve this article. We would like to thank E. Kirby for sending the data for the individual stars he studied in his 2008 paper in electronic format. P.F. thanks the European Southern Observatory for his support. P.F. and P.B. acknowledge support from the Programme National de Physique Stellaire (PNPS) of the Institut National de Sciences de l’Univers of CNRS. LM acknowledges support from “Proyecto interno” of the Universidad Andrés Bello. C.M.B. acknowledges support from FONDECYT regular project 1150060. This research has made use of NASA’s Astrophysics Data System and of the VizieR catalogue access tool, CDS, Strasbourg, France.
References
- Adén, D., Eriksson, K., Feltzing, S., et al. 2011, A&A, 525, A153 [NASA ADS] [CrossRef] [EDP Sciences] [Google Scholar]
- Allen, D., Ryan, S.G., Rossi, S., Beers, T., & Tsangarides, S. A. 2012, A&A, 548, A34 [NASA ADS] [CrossRef] [EDP Sciences] [Google Scholar]
- Alonso, A., Arribas, S., & Martínez-Roger, C. 1999, A&AS, 140, 261 [NASA ADS] [CrossRef] [EDP Sciences] [Google Scholar]
- Alvarez, R., & Plez, B. 1998, A&A, 330, 1109 [NASA ADS] [Google Scholar]
- Aoki, W., Arimoto, N., Sadakane, K., et al. 2009, A&A, 502, 569 [NASA ADS] [CrossRef] [EDP Sciences] [Google Scholar]
- Asplund, M., Gustafsson, B., Kiselman, D., & Eriksson, K. 1997, A&A, 318, 521 [NASA ADS] [Google Scholar]
- Belokurov, V., Zucker, D. B., Evans, N. W., et al. 2006, ApJ, 654, 906 [Google Scholar]
- Brown, T. M., Tumlinson, J., Geha, M., & Simon, J. D. 2014, ApJ, 796, 91 [NASA ADS] [CrossRef] [Google Scholar]
- Bullock, J. S., Kravtsov, A. V., & Weinberg, D. H. 2000, ApJ, 539, 517 [NASA ADS] [CrossRef] [Google Scholar]
- Caffau, E., Ludwig, H.-G., Steffen, M., Freytag, B., & Bonifacio, P. 2011, Sol. Phys., 268, 255 [NASA ADS] [CrossRef] [Google Scholar]
- Cescutti, G., Romano, D., Matteucci, F., Chiappini, C., & Hirshi, R. 2015, A&A, 577, A139 [NASA ADS] [CrossRef] [EDP Sciences] [Google Scholar]
- Cohen, J. G., & Huang, W. 2009, ApJ, 701, 1053 [NASA ADS] [CrossRef] [Google Scholar]
- Coleman, M. G., de Jong, J. T., & Martin, N. F. 2007, ApJ, 668, 43 [Google Scholar]
- D’Odorico, S., Dekker, H., Mazzoleni, R., et al. 2006, SPIE, 6269, 33 [NASA ADS] [Google Scholar]
- Edvardsson, B., Andersen, J., Gustafsson, B., et al. 1993, A&A, 275, 101 [NASA ADS] [Google Scholar]
- François, P., Depagne, E., Hill, V., Spite, M., et al. 2007, A&A, 476, 935 [NASA ADS] [CrossRef] [EDP Sciences] [Google Scholar]
- Frebel, A. 2010, Astron. Nachr., 331, 474 [NASA ADS] [CrossRef] [Google Scholar]
- Frebel, A., Simon, J. D., Geha, M., & Willman, B., 2010a, ApJ, 708, 560 [NASA ADS] [CrossRef] [Google Scholar]
- Frebel, A., Kirby, E., & Simon, J. D. 2010b, Nature, 464, 72 [NASA ADS] [CrossRef] [Google Scholar]
- Frischknecht, U., Hirschi, R., & Thielemann, F.-K. 2012, A&A, 538, L2 [NASA ADS] [CrossRef] [EDP Sciences] [Google Scholar]
- Fulbright, J. P., Rich, R. M., & Castro, S. 2004, ApJ, 612, 447 [NASA ADS] [CrossRef] [Google Scholar]
- Geisler, D., Smith, V. V., Wallerstein, G., Gonzalez, G., & Charbonnel, C. 2005, AJ, 129, 1428 [NASA ADS] [CrossRef] [Google Scholar]
- Gilmore, G., Norris, J. E., Monaco, L., et al. 2013, ApJ, 763, 61 [NASA ADS] [CrossRef] [Google Scholar]
- Goldoni, P., Royer, F., François, P., et al. 2006, SPIE, 6269, 2 [Google Scholar]
- Gratton, R. G., & Sneden, C. 1994, A&A, 287, 927 [NASA ADS] [Google Scholar]
- Greco, C., Dall’Ora, M., Clementini, G., et al. 2008, ApJ, 675, 73 [Google Scholar]
- Grevesse, N., & Sauval, A. J. 2000, Origin of Elements in the Solar System, ed. O. Manuel, 261 [Google Scholar]
- Gustafsson, B., Bell, R. A., Eriksson, K., & Nordlund, A. 1975, A&A, 42, 407 [NASA ADS] [Google Scholar]
- Gustafsson, B., Edvardsson, B., Eriksson, K., et al. 2003, in Stellar Atmosphere Modeling, eds. I. Hubeny, D. Mihalas, & K. Werner, ASP Conf. Ser., 288, 331 [Google Scholar]
- Gustafsson, B., Edvardsson, B., Eriksson, K., et al. 2008, A&A, 486, 951 [NASA ADS] [CrossRef] [EDP Sciences] [Google Scholar]
- Hill, V., Plez, B., Cayrel, R., et al. 2002, A&A, 387, 560 [NASA ADS] [CrossRef] [EDP Sciences] [Google Scholar]
- Jordi, K., Grebel, E. K., & Ammon, K. 2006, A&A, 460, 339 [NASA ADS] [CrossRef] [EDP Sciences] [Google Scholar]
- Kelson, D. 2003, PASP, 115, 688 [NASA ADS] [CrossRef] [Google Scholar]
- Kirby, E. N., Simon, J. D., Geha, M., Guhathakurta, P., & Frebel, A. 2008, ApJ, 685, L43 [NASA ADS] [CrossRef] [Google Scholar]
- Kirby, E. N., Guhathakurta, P., Simon, J. D., et al. 2010, ApJS, 191, 352 [NASA ADS] [CrossRef] [Google Scholar]
- Kirby, E. N., Cohen, J. G., Guhathakurta, P., et al. 2013, ApJ, 779, 102 [NASA ADS] [CrossRef] [Google Scholar]
- Koch, A., & Rich, R. M. 2014, ApJ, 794, 89 [NASA ADS] [CrossRef] [Google Scholar]
- Koch, A., McWilliam, A., Grebel, E. K., Zucker, D. B., & Belokurov, V. 2008, ApJ, 688, L13 [NASA ADS] [CrossRef] [Google Scholar]
- Koch, A., Wilkinson, M. I., Kleyna, J. T., et al. 2009, ApJ, 690, 453 [NASA ADS] [CrossRef] [Google Scholar]
- Koch, A., Feltzing, S., Adén, D., & Matteucci, F. 2013, A&A, 554, A5 [NASA ADS] [CrossRef] [EDP Sciences] [Google Scholar]
- Kuehn, C., Kinemuchi, K., & Ripepi, V. 2008, ApJ, 674, 81 [Google Scholar]
- Lemasle, B., François, P., Piersimoni, A., et al. 2008, A&A, 490, 613 [NASA ADS] [CrossRef] [EDP Sciences] [Google Scholar]
- Lodders, L., Palme, H., & Gail, H.-P. 2009, LanB 4, 44 Abundances of the elements in the Solar System. ed. J. E. Trumper, Landolt-Bornstein (Berlin: Springer-Verlag) [Google Scholar]
- McWilliam, A., & Preston, G. 1995, AJ, 106, 2757 [NASA ADS] [CrossRef] [Google Scholar]
- Martin, N. F., Coleman, M. G., De Jong, J. T. A., et al. 2008, ApJ, 672, L13 [NASA ADS] [CrossRef] [Google Scholar]
- Moore, B., Ghigna, S., Governato, F., et al. 1999, ApJ, 524, L19 [Google Scholar]
- Moretti, M. I., Dall’Ora, M., Ripepi, V., et al. 2009, ApJ, 699, 125 [Google Scholar]
- Musella, I., Ripepi, V., Marconi, M., et al. 2012, ApJ, 756, 121 [NASA ADS] [CrossRef] [Google Scholar]
- Okamoto, S., Arimoto, N., Yamada, Y., & Onodera, M. 2012, ApJ, 744, 96 [NASA ADS] [CrossRef] [Google Scholar]
- Pignatari, M., Gallino, R., Meynet, G., et al. 2008, A&A, 687, L95 [Google Scholar]
- Plez, B., Brett, J. M., & Nordlund, A. 1992, A&A, 256, 551 [NASA ADS] [Google Scholar]
- Ramírez, I., & Meléndez, J. 2005, ApJ, 626, 465 [NASA ADS] [CrossRef] [Google Scholar]
- Ricotti, M., & Gnedin, N. Y. 2005, ApJ, 629, 259 [NASA ADS] [CrossRef] [Google Scholar]
- Roderick, T. A., Jerjen, H., Mackey, A. D., & Da Costa, G. 2015, ApJ, 804, 134 [NASA ADS] [CrossRef] [Google Scholar]
- Roederer, I. U., Preston, G. W., Thompson, I. B., et al. 2014, AJ, 147, 136 [NASA ADS] [CrossRef] [Google Scholar]
- Schlegel, D. J., Finkbeiner, D. P., & Davis, M. 1998, ApJ, 500, 525 [NASA ADS] [CrossRef] [Google Scholar]
- Shetrone, M. D., Côté, P., & Sargent, W. L.W. 2001, ApJ, 548, 592 [NASA ADS] [CrossRef] [Google Scholar]
- Shetrone, M., Venn, K. A., Tolstoy, E., et al. 2003, AJ, 125, 684 [NASA ADS] [CrossRef] [Google Scholar]
- Simon, J. D., & Geha, M. 2007, ApJ, 670, 313 [NASA ADS] [CrossRef] [Google Scholar]
- Simon, J. D., Frebel, A., McWilliam, A., Kirby, E. N., & Thompson, I. B. 2010, ApJ, 716, 446 [NASA ADS] [CrossRef] [Google Scholar]
- Ural, U., Wilkinson, M. I., Koch, A., et al. 2010, MNRAS, 402, 1357 [NASA ADS] [CrossRef] [Google Scholar]
- Van Dokkum, P. 2001, PASP, 562, 35 [Google Scholar]
- Vargas, L. C., Geha, M., Kirby, E. N., & Simon, J. D. 2013, ApJ, 767, 134 [NASA ADS] [CrossRef] [Google Scholar]
- Vernet, J., Dekker, H., & D’Odorico, S. 2011, A&A, 536, A105 [NASA ADS] [CrossRef] [EDP Sciences] [Google Scholar]
- Vincenzo, F., Matteucci, F., Vattakunnel, S., & Lanfranchi, G. A. 2014, MNRAS, 441, 2815 [NASA ADS] [CrossRef] [Google Scholar]
- Wanajo, S. 2013, ApJ, 770, L12 [Google Scholar]
- Weisz, D. R., Dolphin, A. E., Skillman, E. D., et al. 2014, ApJ, 789, 148 [NASA ADS] [CrossRef] [Google Scholar]
- Walsh, S. M., Jerjen, H., & Willman, B. 2007, ApJ, 662, L83 [NASA ADS] [CrossRef] [Google Scholar]
- Walsh, S., Jerjen, H., & Willman, B. 2008, Galaxies in the Local Volume, Astrophysics and Space Science Proceedings (Springer: The Netherlands), 191 [Google Scholar]
- Webster, D., Bland-Hawthorn, J., & Sutherland, K. 2015, ApJ, 799, 21 [NASA ADS] [CrossRef] [Google Scholar]
- Zucker, D. B., Belokurov, V., Evans, N. W., et al. 2006, ApJ, 643, 103 [Google Scholar]
Appendix A: Tables
Target coordinates, S/N, and radial velocities.
Log of the observations.
Stellar parameters.
Lines used for the analysis.
Error budget.
Detailed abundances : [X/Fe] for all the elements except Fe for which [Fe/H] is given.
BooII-15 abundance comparison.
Leo IV − S1 abundance ratio comparison.
All Tables
Detailed abundances : [X/Fe] for all the elements except Fe for which [Fe/H] is given.
All Figures
|
Fig. 1 Alpha elements: gray circles represent literature data for field stars from Roederer et al. (2014). Blue triangles are literature data for dwarf spheroidal galaxies in Frebel (2010) who collected results from (Shetrone et al. 2001, 2003; Cohen & Huang 2004; Fulbright et al. 2004; Geisler et al. 2005; Aoki et al. 2009; Frebel et al. 2010a,b; Simon et al. 2010) Red circles represent the results for our sample of UfDSph stars. |
| In the text | |
|
Fig. 2 Al and Na abundance ratios: gray circles represent literature data for field stars from Roederer et al. (2014). Blue triangles are literature data for dwarf spheroidal galaxies gathered in Frebel (2010) (see details in Fig. 2). Red circles represent the results for our sample of UfDSph stars. |
| In the text | |
|
Fig. 3 Neutron capture elements: Gray circles represent literature data for field stars from Roederer et al. (2014). Blue triangles are literature data for dwarf spheroidal galaxies gathered in Frebel (2010, see details in Fig. 2). Red circles represent the results for our sample of UfDSph stars. Red triangles represent upper limits for stars of our sample. |
| In the text | |
|
Fig. 4 Abundance results for the CVnI galaxy stars. Red circle represent our two stars. Green symbols are results from Kirby et al. (2010). Blue symbols are results from Vargas et al. (2013). |
| In the text | |
|
Fig. 5 Abundance results for the CVnII galaxy stars. Red circles represent the abundance results for our stars. Gray circles represent literature data for field stars from Roederer et al. (2014). |
| In the text | |
|
Fig. 6 Comparison of the observed spectrum represented by pluses and synthetic spectra with different barium abundances. |
| In the text | |
|
Fig. 7 Comparison of the observed spectrum represented by pluses and synthetic spectra with different strontium abundances. |
| In the text | |
|
Fig. 8 Our results for Hercules are presented as red circles. We have added the results from Koch et al. (2008, 2013) as blue triangles (triangles pointing down are upper limits) and Adèn et al. (2011) as blue pluses. Gray dots are literature data for the field halo stars from Roederer et al. (2014). |
| In the text | |
|
Fig. 9 Comparison of the observed spectrum represented by pluses and synthetic spectra. The dashed black line is computed for a barium abundance [Ba/Fe] = −1.50 dex, which correspond to the 3σ upper limit of Koch et al. (2013). The higher quality of the X-Shooter spectra permits the detection of the barium line. The blue line is computed with a barium value [Ba/Fe] = −0.87 dex corresponding to our result. |
| In the text | |
|
Fig. 10 Comparison of the observed spectrum represented by pluses and synthetic spectra. The dashed black line is computed for a barium abundance [Ba/Fe] = −1.50 dex, which corresponds to the 3σ upper limit of Koch et al. (2013). The higher quality of the X-Shooter spectra permits the detection of the barium line. The blue line is computed with a barium value [Ba/Fe] = −0.81 dex, which corresponds to our result. |
| In the text | |
|
Fig. 11 Our results for Hercules and Leo IV are presented as a red circle. We have added the results from Koch et al. (2008, 2013) and Adèn et al. (2011) as red triangles. Blue circles represent our results for the remaining galaxies. Blue squares represent literature data for BooI. We did not include the results with upper limits only. Gray dots are literature data for the field halo stars from Roederer et al. (2014). |
| In the text | |
|
Fig. 12 Our results for Hercules are presented as red circle. We have added the results from Koch et al. (2008, 2013) and Adèn et al. (2011) as red triangles. Blue circles are our results for the remaining galaxies. Blue squares are literature data for BooI. We did not include the results with upper limits only. Grey dots are literature data for the field halo stars from Roederer et al. (2014). |
| In the text | |
Current usage metrics show cumulative count of Article Views (full-text article views including HTML views, PDF and ePub downloads, according to the available data) and Abstracts Views on Vision4Press platform.
Data correspond to usage on the plateform after 2015. The current usage metrics is available 48-96 hours after online publication and is updated daily on week days.
Initial download of the metrics may take a while.