Fig. 11
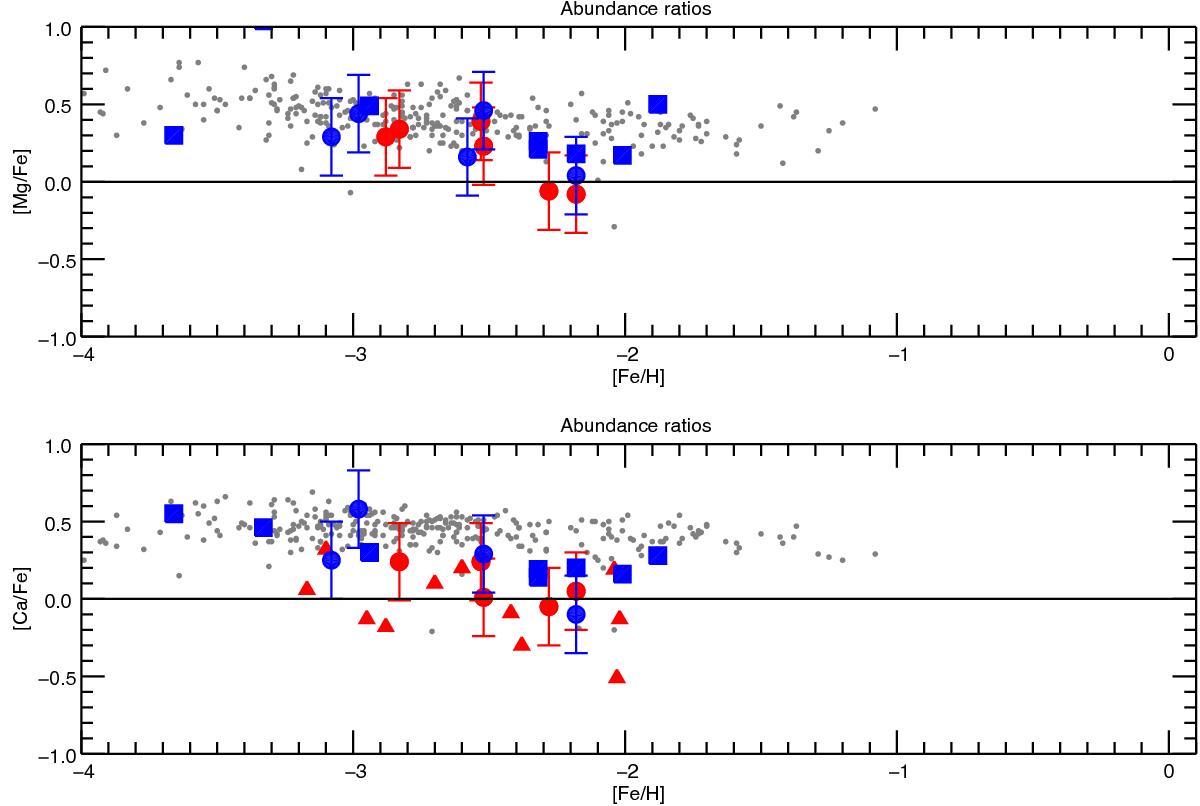
Our results for Hercules and Leo IV are presented as a red circle. We have added the results from Koch et al. (2008, 2013) and Adèn et al. (2011) as red triangles. Blue circles represent our results for the remaining galaxies. Blue squares represent literature data for BooI. We did not include the results with upper limits only. Gray dots are literature data for the field halo stars from Roederer et al. (2014).
Current usage metrics show cumulative count of Article Views (full-text article views including HTML views, PDF and ePub downloads, according to the available data) and Abstracts Views on Vision4Press platform.
Data correspond to usage on the plateform after 2015. The current usage metrics is available 48-96 hours after online publication and is updated daily on week days.
Initial download of the metrics may take a while.