Free Access
Fig. 4
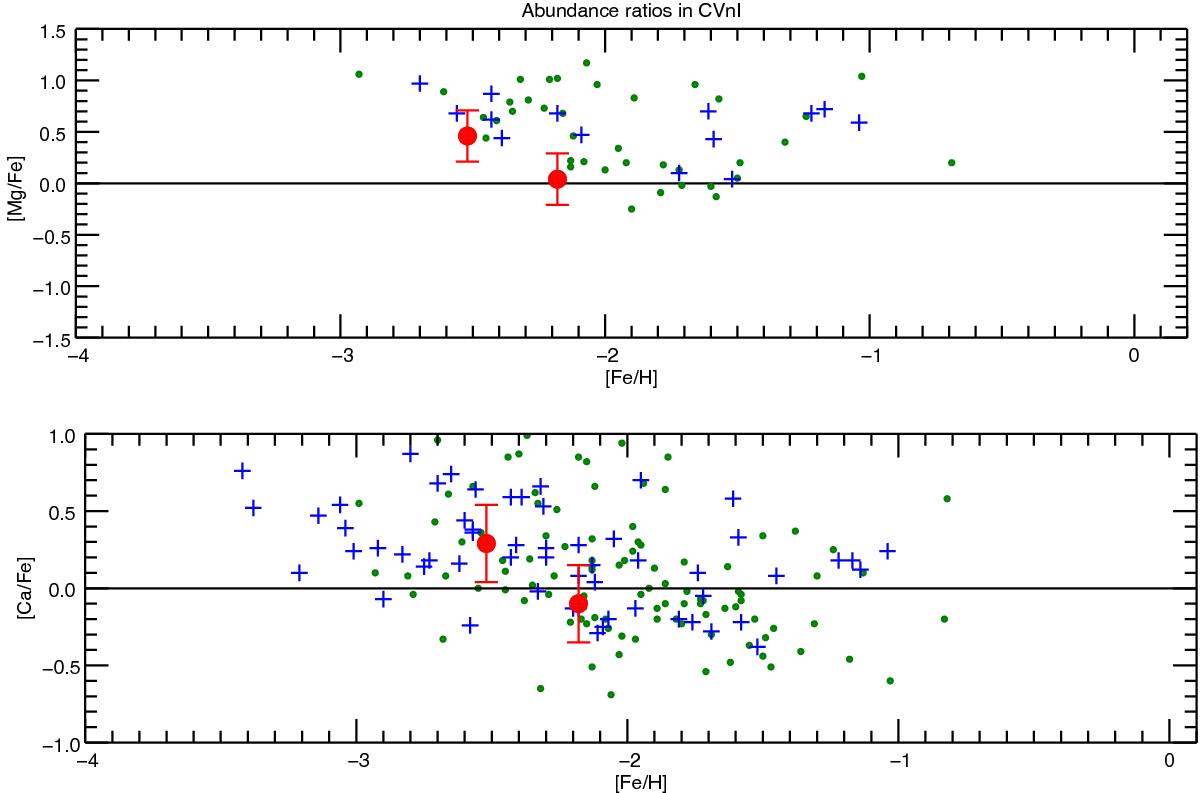
Abundance results for the CVnI galaxy stars. Red circle represent our two stars. Green symbols are results from Kirby et al. (2010). Blue symbols are results from Vargas et al. (2013).
Current usage metrics show cumulative count of Article Views (full-text article views including HTML views, PDF and ePub downloads, according to the available data) and Abstracts Views on Vision4Press platform.
Data correspond to usage on the plateform after 2015. The current usage metrics is available 48-96 hours after online publication and is updated daily on week days.
Initial download of the metrics may take a while.