Fig. 9
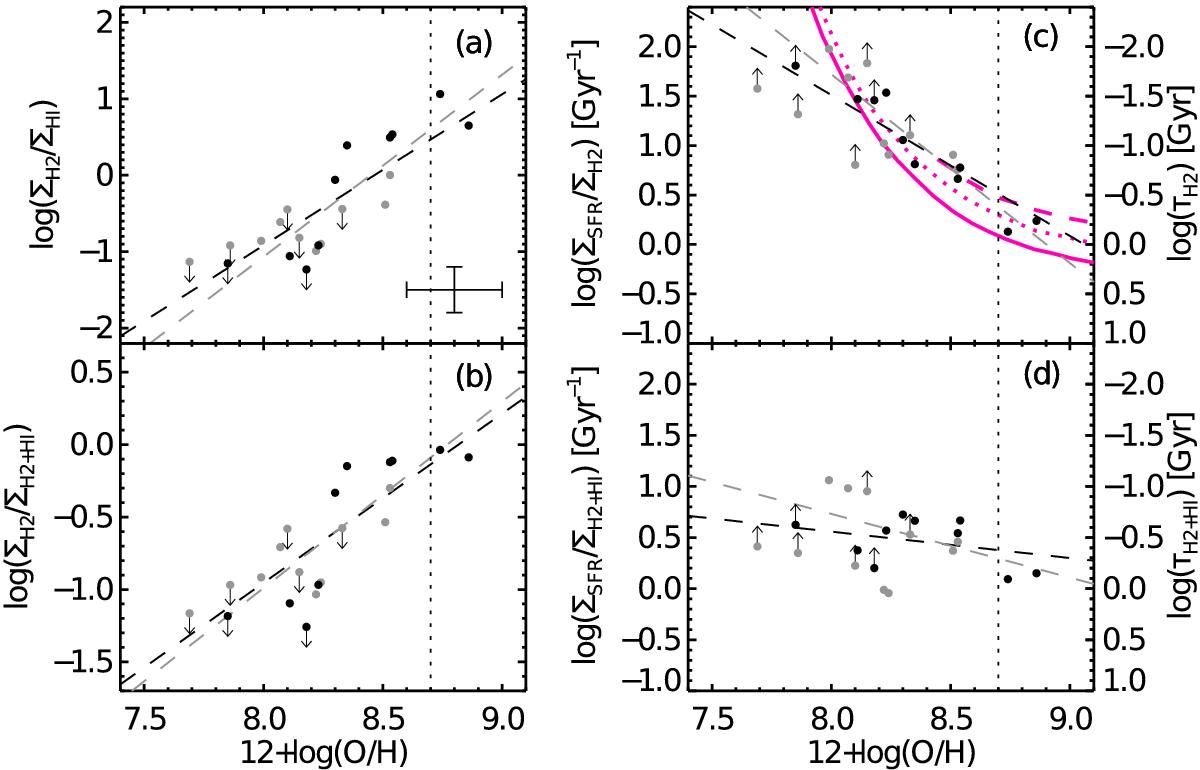
The molecular to atomic ratio a), the molecular fraction b), and the H2 and H2 +Hi depletion timescale (c) and d), respectively) as a function of metallicity. Symbols are as in Fig. 8. Black and gray dashed lines show linear best fits to all data points and only secure detections, respectively. Solid, dotted, and dashed magenta lines in panel c show model predictions by Krumholz et al. (2011) for different values of ΣH2 + HI (80, 20 and 5 M⊙ pc-2, respectively).
Current usage metrics show cumulative count of Article Views (full-text article views including HTML views, PDF and ePub downloads, according to the available data) and Abstracts Views on Vision4Press platform.
Data correspond to usage on the plateform after 2015. The current usage metrics is available 48-96 hours after online publication and is updated daily on week days.
Initial download of the metrics may take a while.