Fig. 8
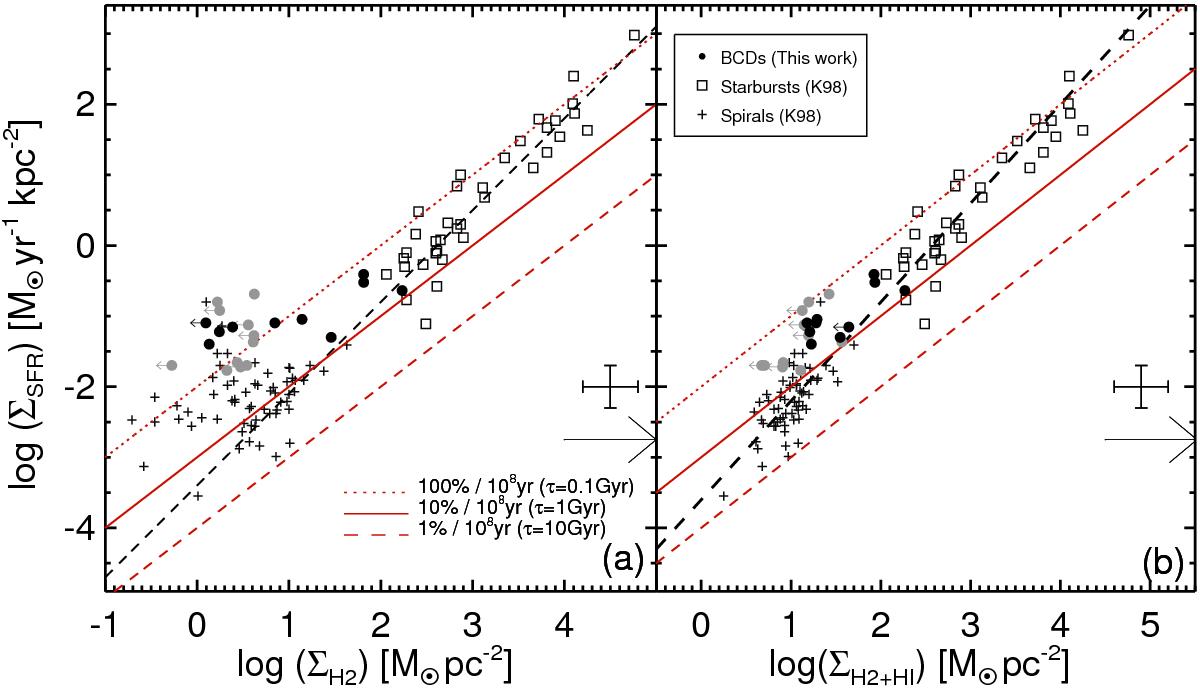
Star-formation rate surface density as a function of H2 (left) and Hi+H2 (right) gas surface densities. Black dots showsubsample I and gray dots showsubsample II. The black dashed lines show the fits to the H2 and H2 +Hi SK law by Leroy et al. (2005) and Shi et al. (2011), respectively. Red lines indicate constant star-formation efficiencies (depletion timescales). Large arrows indicate the shift in H2 surface density by assuming a CO-to-H2 conversion factor 10 times larger than that of the Milky Way for the molecular mass. Error bars indicate typical uncertainties for our sample.
Current usage metrics show cumulative count of Article Views (full-text article views including HTML views, PDF and ePub downloads, according to the available data) and Abstracts Views on Vision4Press platform.
Data correspond to usage on the plateform after 2015. The current usage metrics is available 48-96 hours after online publication and is updated daily on week days.
Initial download of the metrics may take a while.