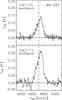
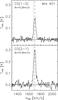
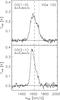
Fig. 2
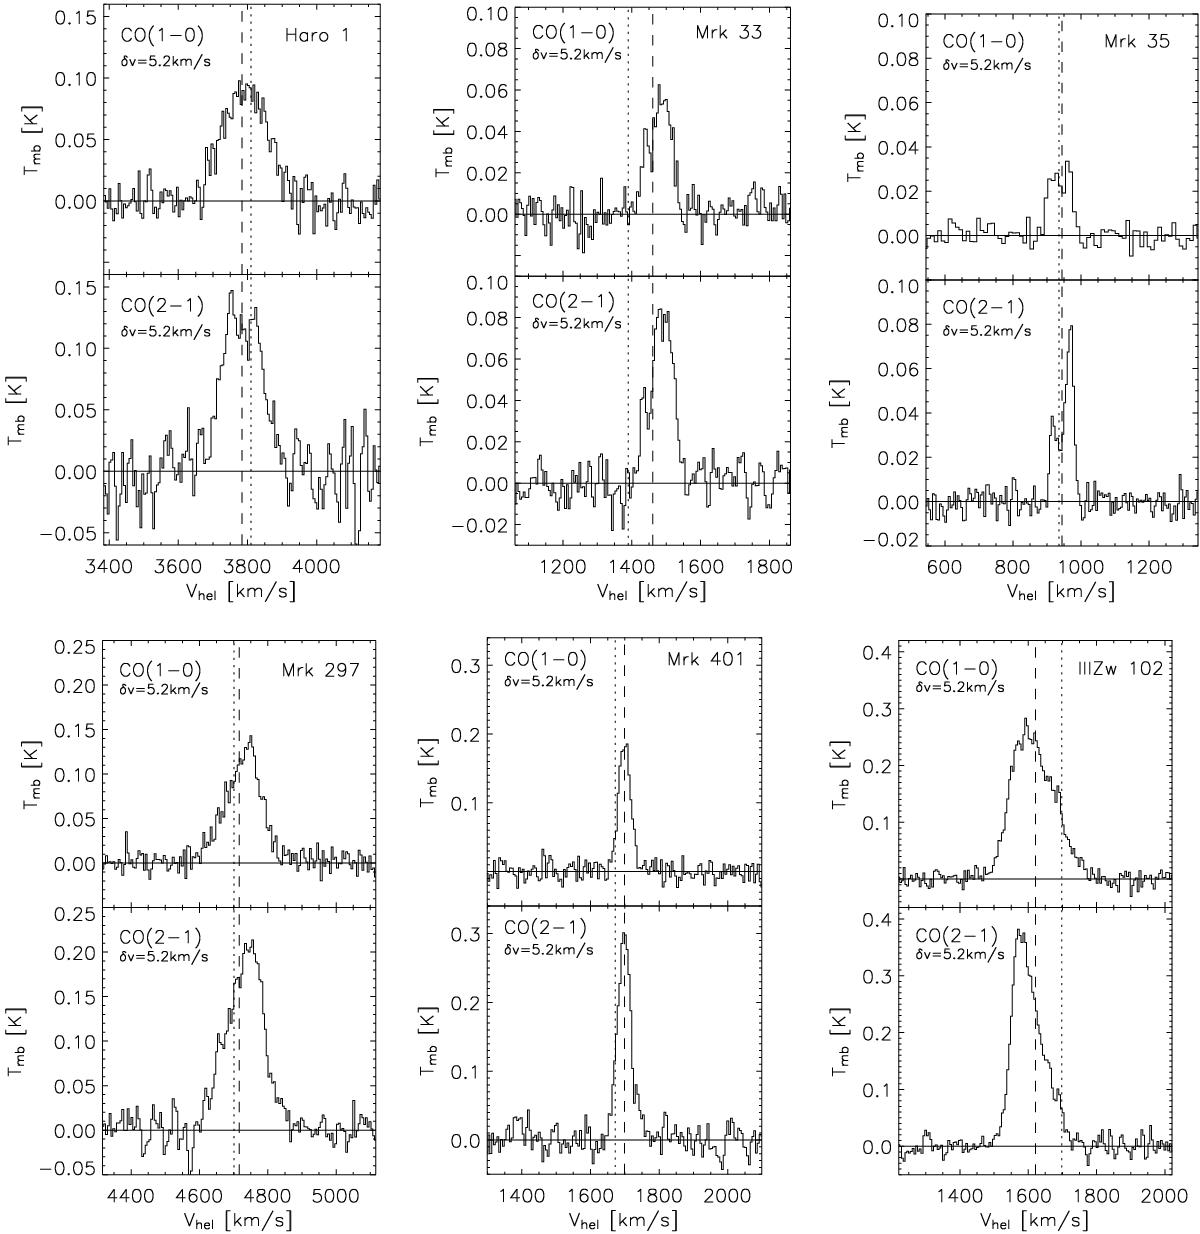
CO detections: CO J = 1 → 0 and J = 2 → 1 spectra are shown for the target galaxies. Horizontal lines indicate the adopted baseline, while vertical lines mark the systemic (heliocentric) velocities as measured from the optical (dotted line) and in 21 cm (dashed lines). The velocity resolution δυ, CO transition, and the name of the galaxy are also labeled in each plot.
Current usage metrics show cumulative count of Article Views (full-text article views including HTML views, PDF and ePub downloads, according to the available data) and Abstracts Views on Vision4Press platform.
Data correspond to usage on the plateform after 2015. The current usage metrics is available 48-96 hours after online publication and is updated daily on week days.
Initial download of the metrics may take a while.