Fig. 14
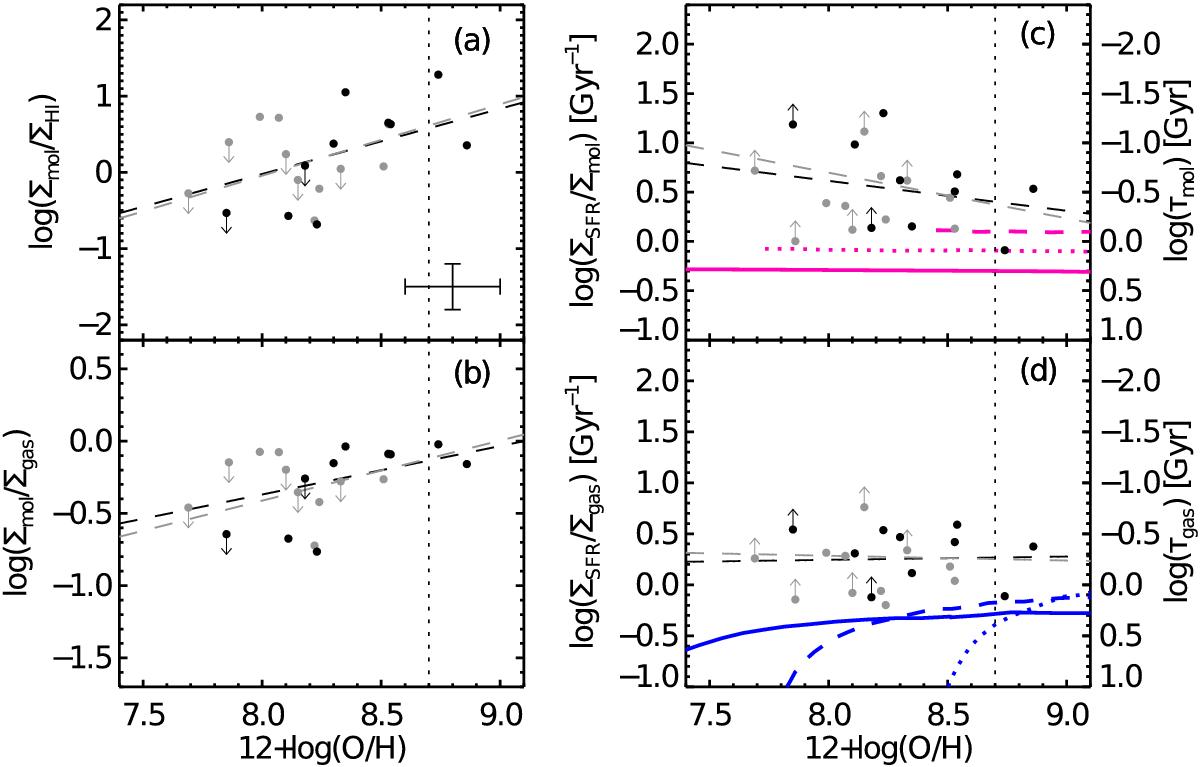
Same as Fig. 9, but using the molecular masses derived using αCO(Z) from Eq. (2) (see text). Black and gray dashed lines show linear best fits tosubsample I andsubsample II. Solid, dotted and dashed magenta (blue) lines in panel c), d) show model predictions by Krumholz et al. (2011) for different values of Σgas (80, 20 and 5 M⊙ pc-2, respectively).
Current usage metrics show cumulative count of Article Views (full-text article views including HTML views, PDF and ePub downloads, according to the available data) and Abstracts Views on Vision4Press platform.
Data correspond to usage on the plateform after 2015. The current usage metrics is available 48-96 hours after online publication and is updated daily on week days.
Initial download of the metrics may take a while.