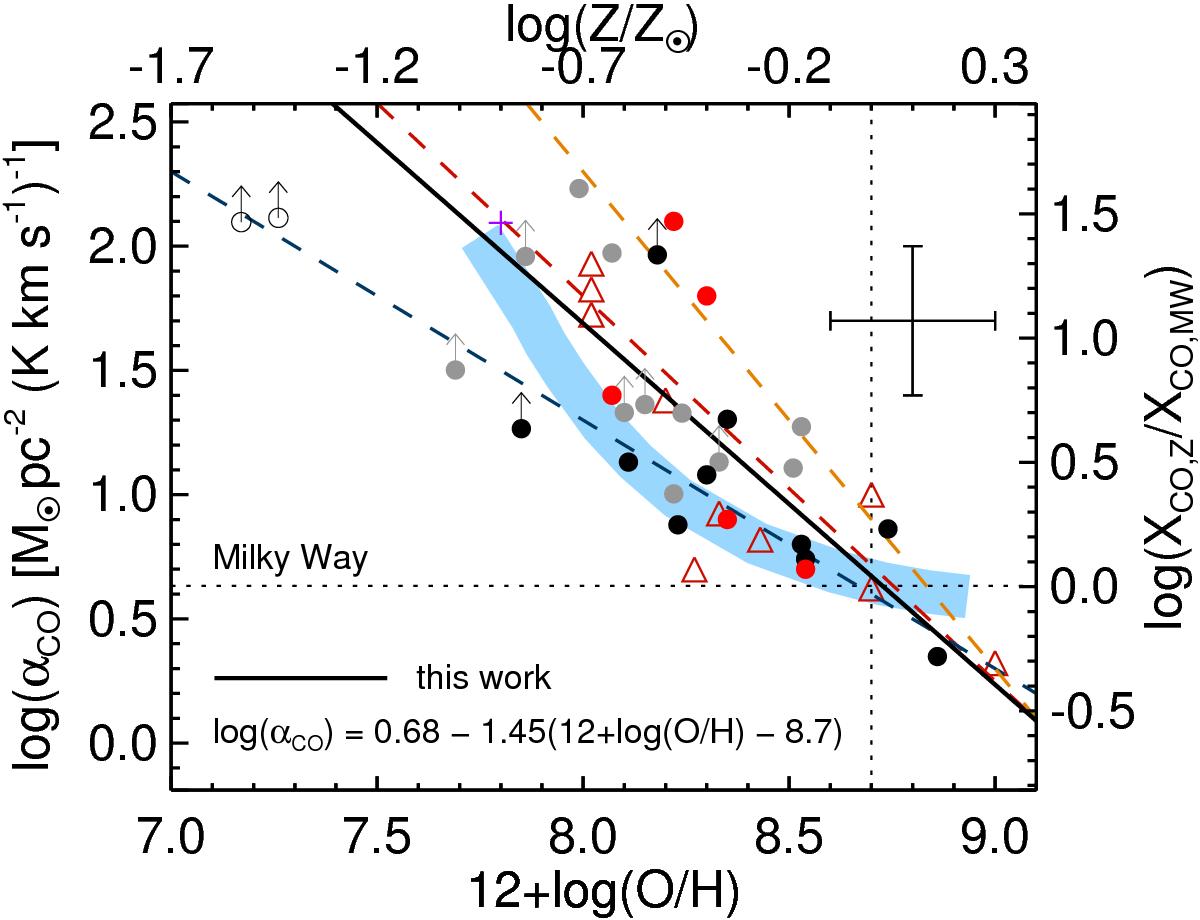
Fig. 11

CO-to-H2 conversion factor, αCO, as a function of the gas-phase metallicity. The right y-axis shows the ratio between the metallicity-dependent conversion factor and the constant value for the Milky Way (horizontal dashed line). A dotted vertical line indicates the solar metallicity. Black and gray dots show subsample I and subsample II BCDs, respectively, while the black solid line shows their best linear fit, indicated in the legend. Error bars indicate typical uncertainties for our sample. Red dots indicate dust-based measurements for five BCDs in our sample with Herschel data (see text). Triangles show dust-based measurements for Local Volume galaxies from Leroy et al. (2011), open circles show lower limits for the extremely metal-poor BCDs SBS 0335-052 and I Zw 18 (Hunt et al. 2014), and the magenta cross corresponds to the dIrr galaxy WLM from Elmegreen et al. (2013). Blue, red, and orange dashed lines show best fits for the same relation given by Arimoto et al. (1996), Genzel et al. (2012), and Schruba et al. (2012), respectively. The model prediction of Wolfire et al. (2010) (as presented in Sandstrom et al. 2013) is shown as a light blue band.
Current usage metrics show cumulative count of Article Views (full-text article views including HTML views, PDF and ePub downloads, according to the available data) and Abstracts Views on Vision4Press platform.
Data correspond to usage on the plateform after 2015. The current usage metrics is available 48-96 hours after online publication and is updated daily on week days.
Initial download of the metrics may take a while.


