Fig. 10
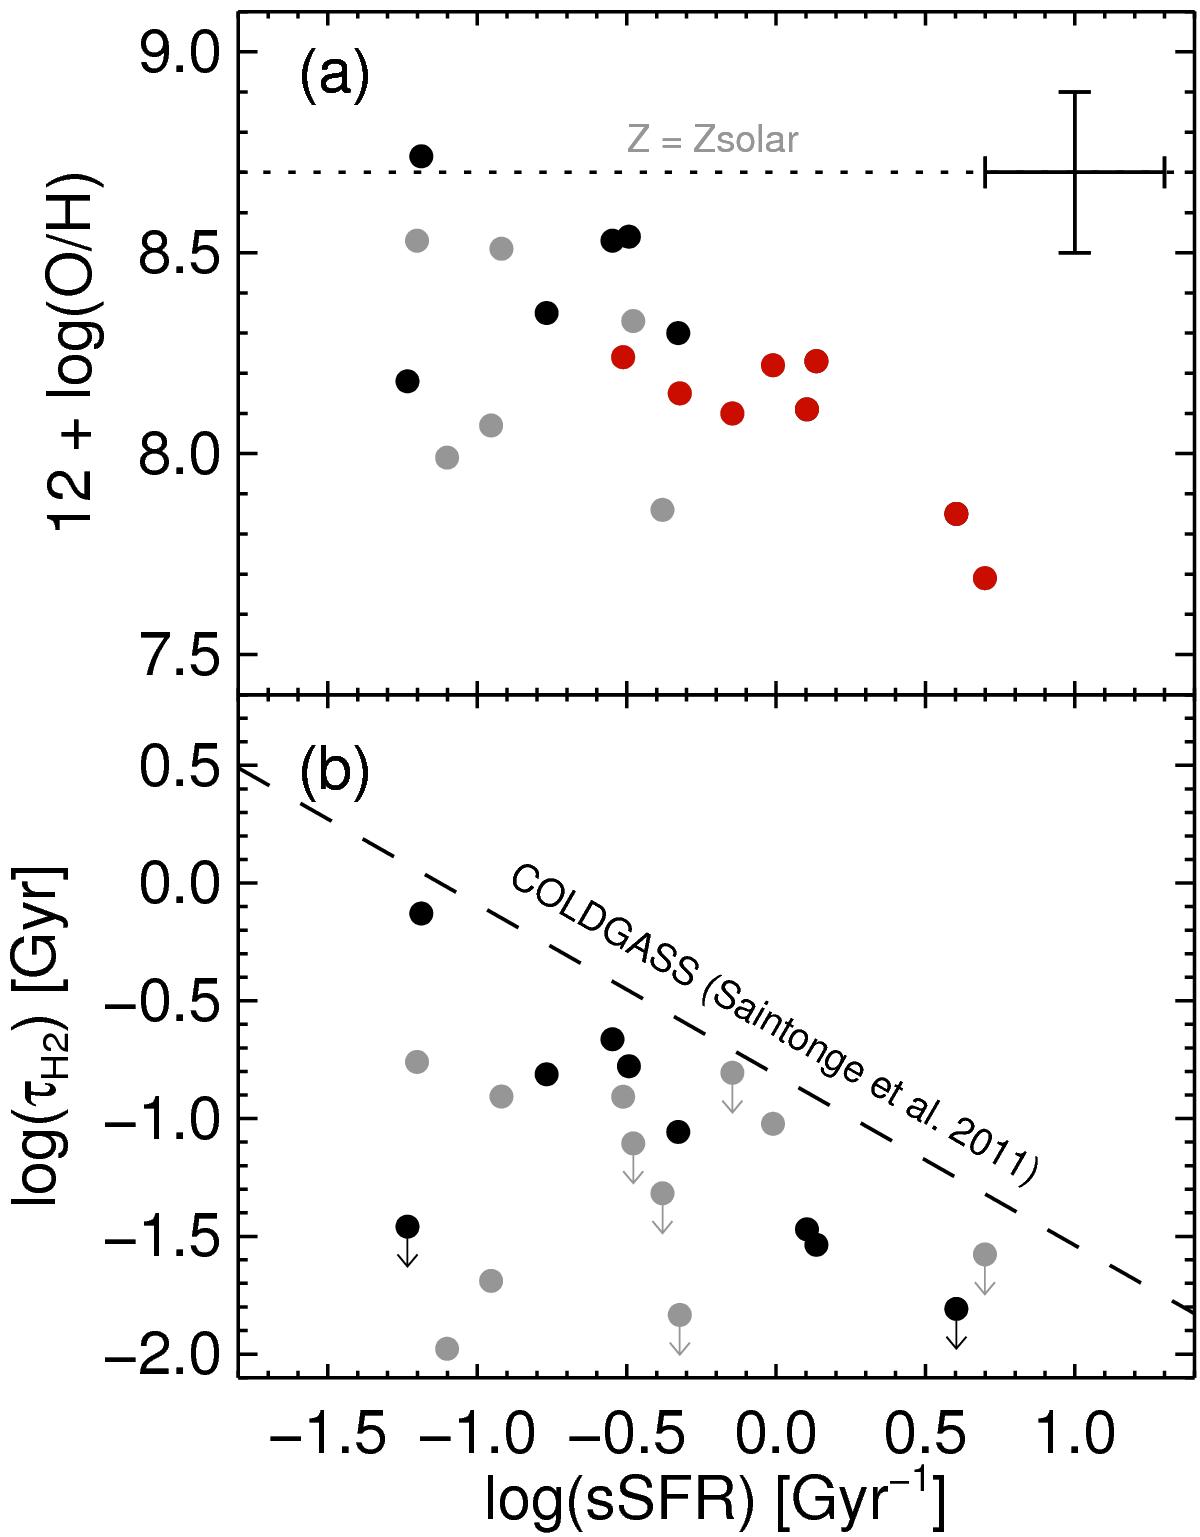
Metallicity a) and H2 depletion timescale b) as a function of specific SFR. Symbols are as in Fig. 9, but red points in a) indicate BCDs with higher gas fractions (MHI/ (MHI + M∗) > 0.5) BCDs. The dotted line in a) indicates solar metallicity, while the dashed line in b) shows the correlation found by Saintonge et al. (2011) for local star-forming disk galaxies of stellar masses M∗ ≳ 1010M⊙.
Current usage metrics show cumulative count of Article Views (full-text article views including HTML views, PDF and ePub downloads, according to the available data) and Abstracts Views on Vision4Press platform.
Data correspond to usage on the plateform after 2015. The current usage metrics is available 48-96 hours after online publication and is updated daily on week days.
Initial download of the metrics may take a while.