Fig. 9
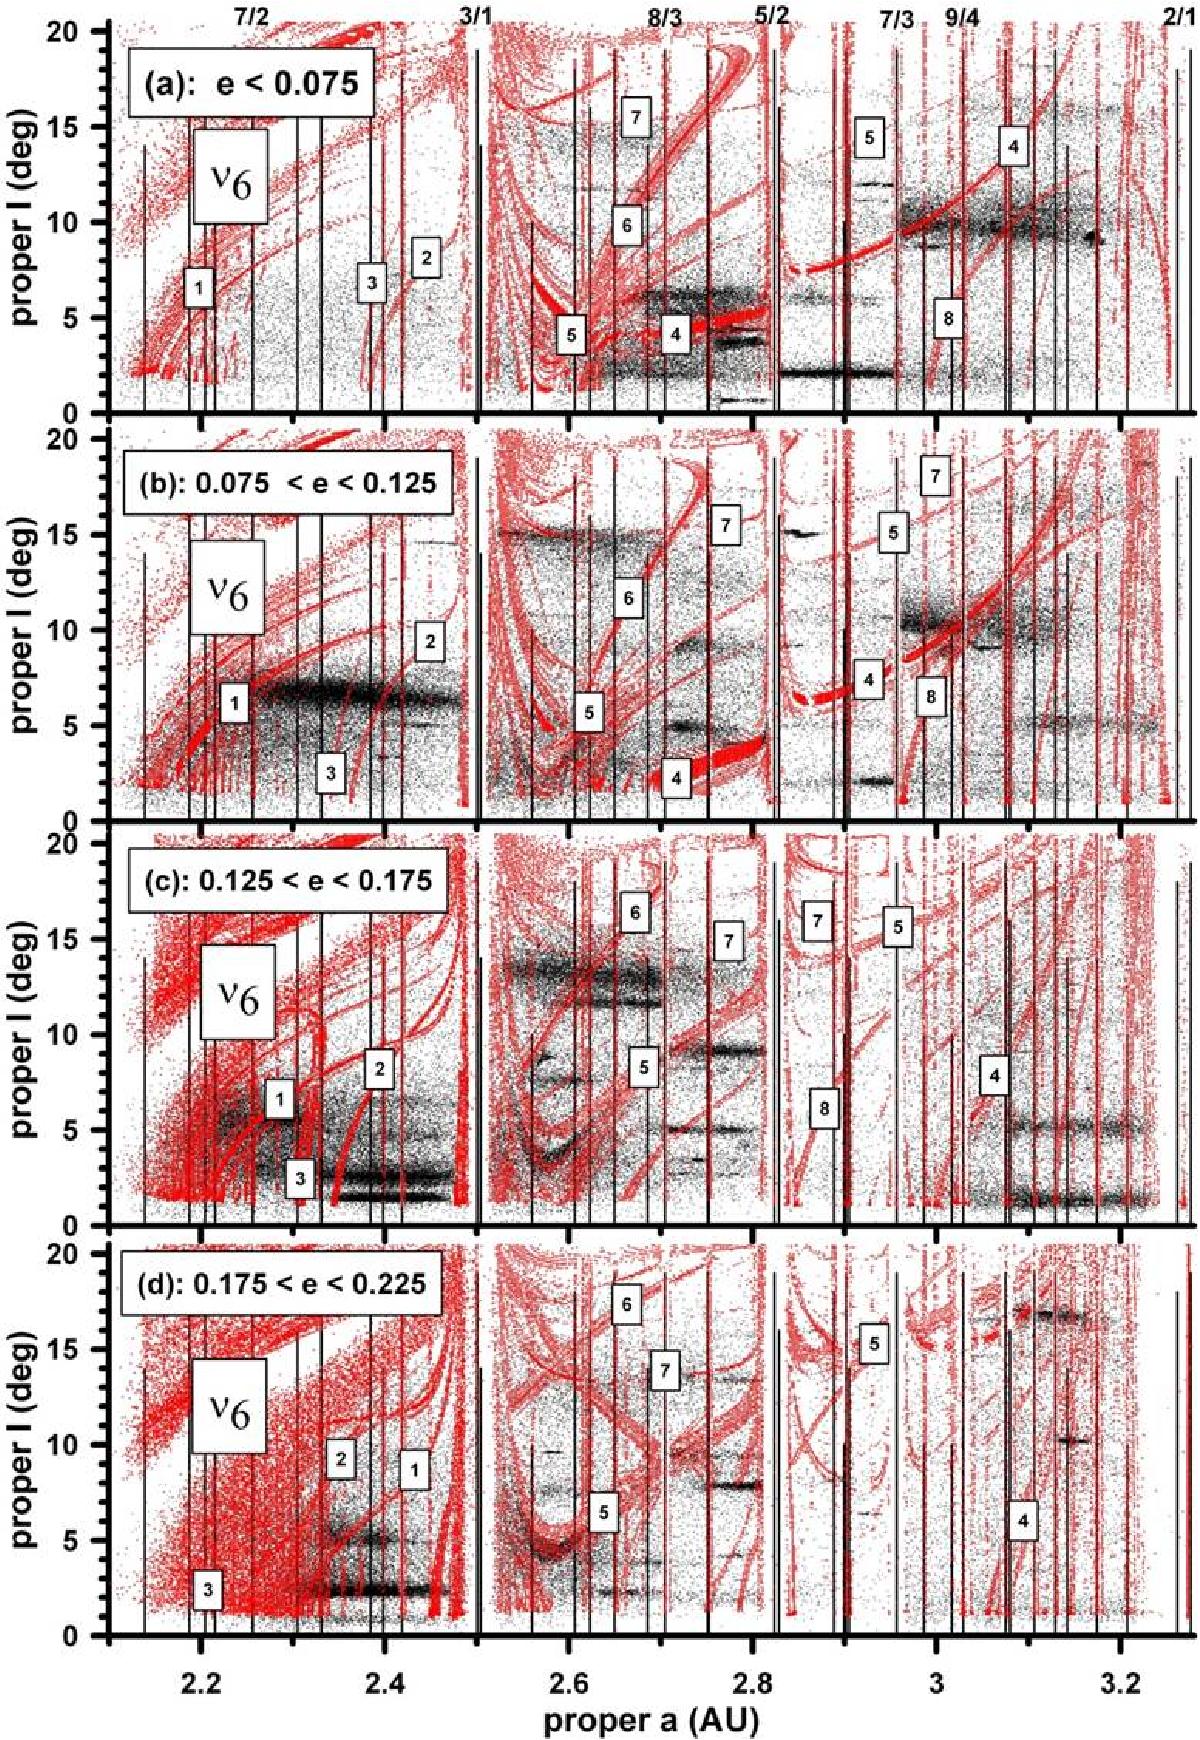
Averaged dynamical maps in the proper elements space limited to Ip< 20°. The red dots are averaged orbital elements of the test particles, whose behavior is affected by MMRs and nonlinear SRs. The black dots are proper elements of the objects from the AstDyS-catalog. The location of the main MMRs is sketched by vertical lines, while the main nonlinear SRs are indicated by the group number from Table A.2.
Current usage metrics show cumulative count of Article Views (full-text article views including HTML views, PDF and ePub downloads, according to the available data) and Abstracts Views on Vision4Press platform.
Data correspond to usage on the plateform after 2015. The current usage metrics is available 48-96 hours after online publication and is updated daily on week days.
Initial download of the metrics may take a while.