Fig. 2
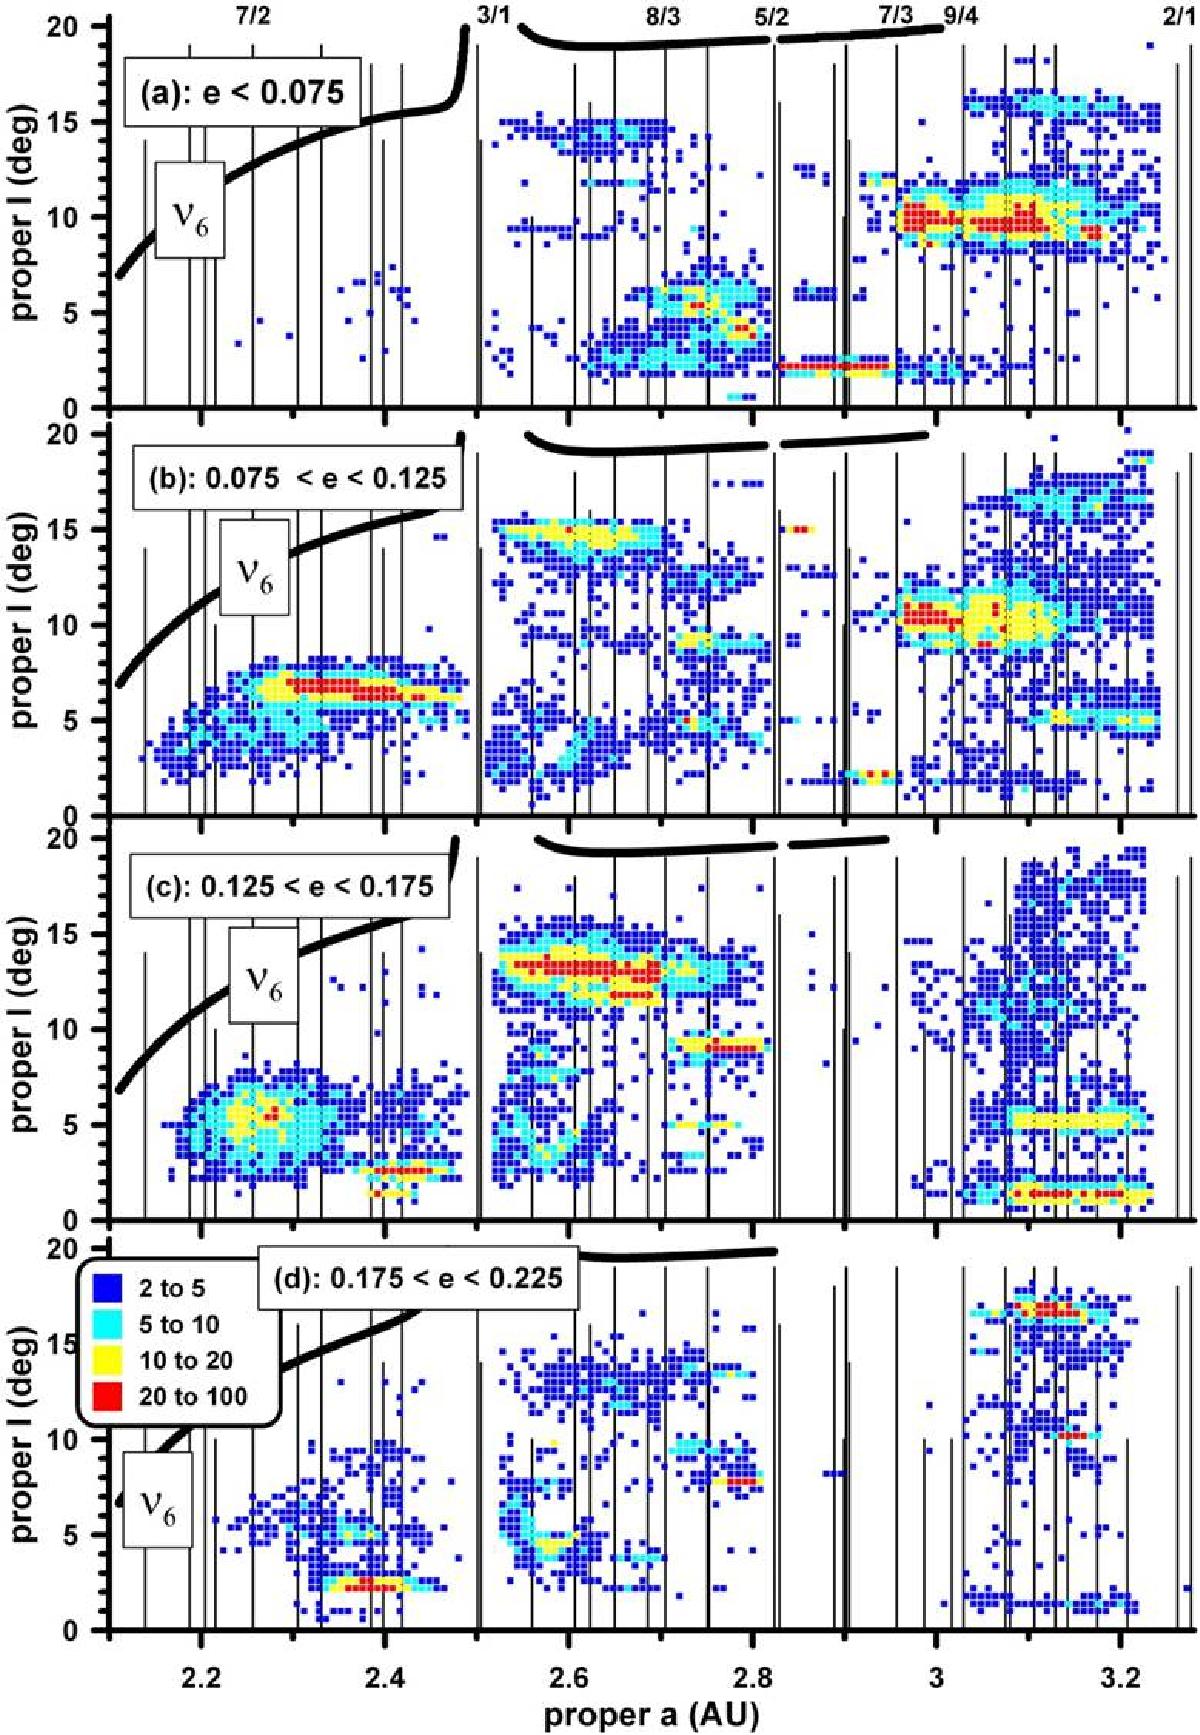
Density distribution of MB objects in the proper (ap, Ip) element space limited to Ip ≤ 20°. Only objects with absolute magnitudes below 15.5 were considered. The eccentricity interval shown on the top of each graph. The density or number (in per cent) of the asteroids inside a cell is shown with different colors (see the legend box); blue corresponds to minimal values (between 2 and 5) and red to maximal values (>20). The size of the cell is ![]() . The location of main MMRs is indicated with vertical lines and the location of the linear ν6 SR is indicated with thick curves.
. The location of main MMRs is indicated with vertical lines and the location of the linear ν6 SR is indicated with thick curves.
Current usage metrics show cumulative count of Article Views (full-text article views including HTML views, PDF and ePub downloads, according to the available data) and Abstracts Views on Vision4Press platform.
Data correspond to usage on the plateform after 2015. The current usage metrics is available 48-96 hours after online publication and is updated daily on week days.
Initial download of the metrics may take a while.