Fig. D.1
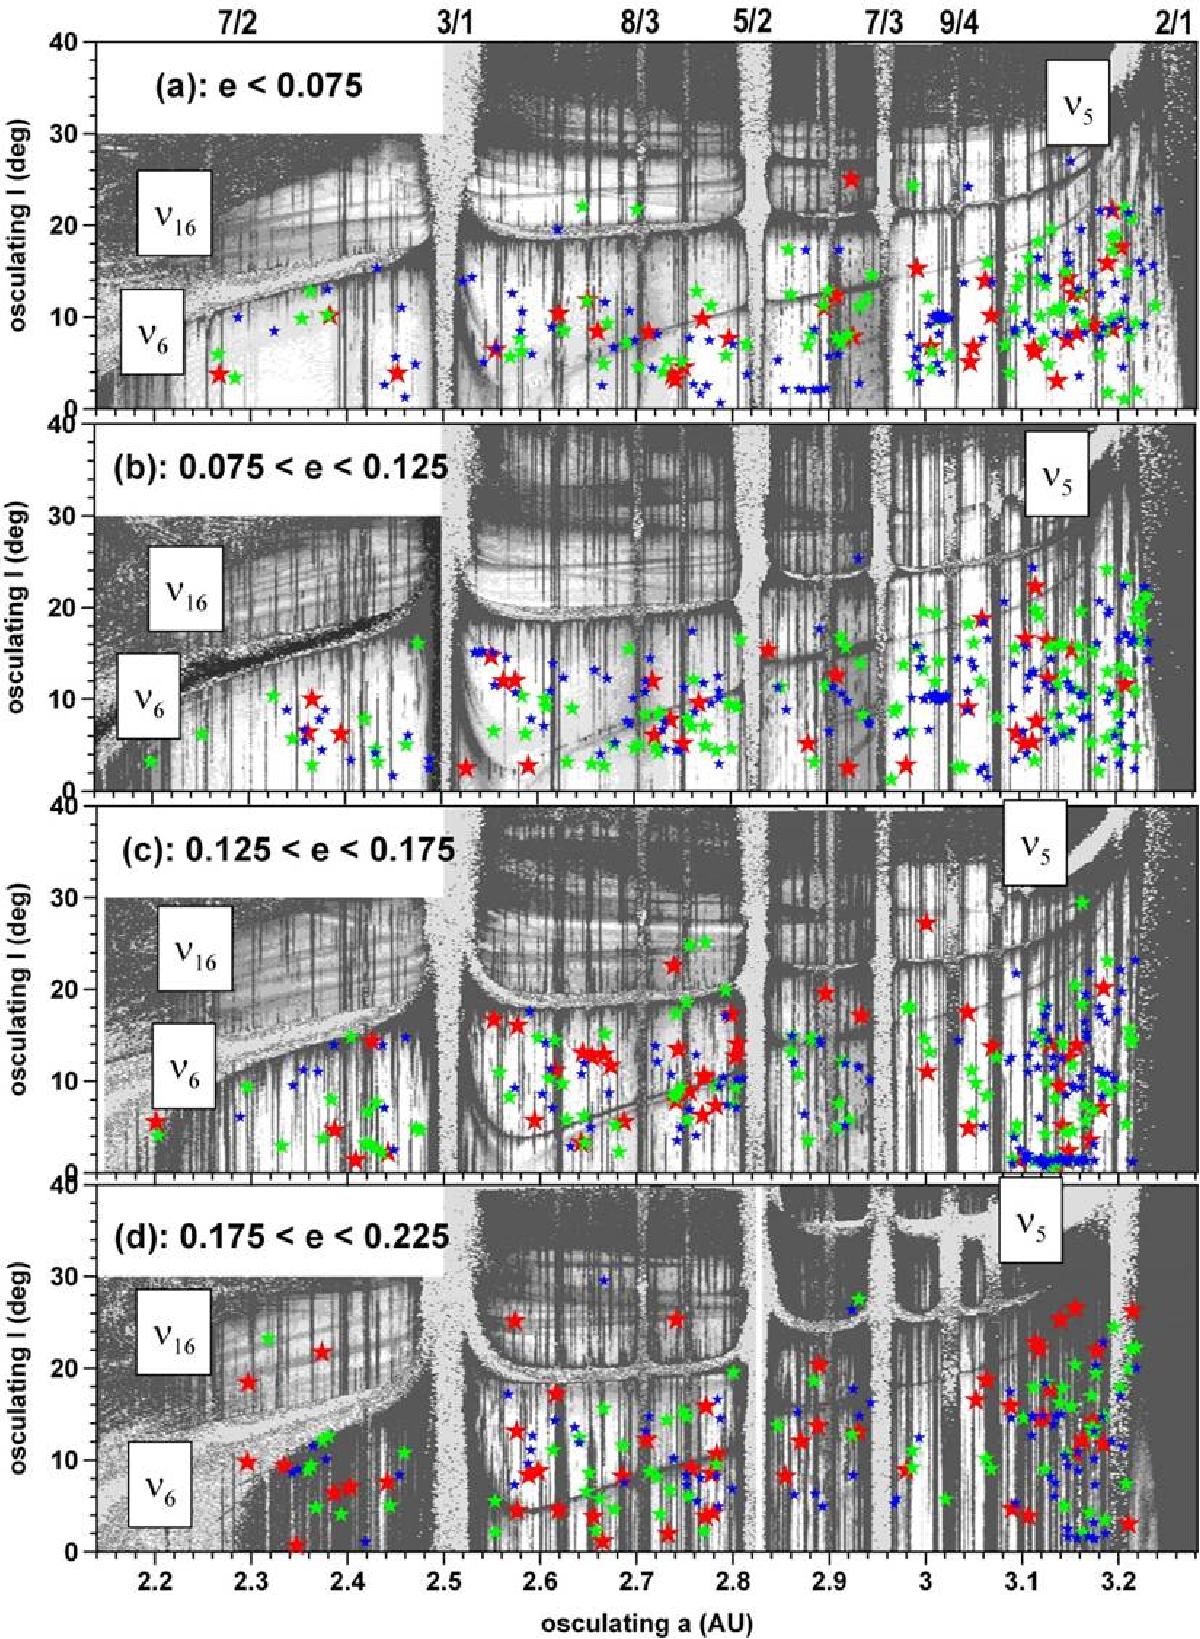
Dynamical maps on the (a, I)-planes of the osculating semimajor axis and inclination. The gray color levels indicate stochasticity of motion: lighter regions corresponds to regular motion, while darker tones indicate increasingly chaotic motion. The hatched regions correspond to initial conditions that lead to the escape of objects within 4.2 Myr. The large objects from the corresponding eccentricity interval are superposed on each graph: Red stars are objects with diameters D> 100 km, green stars are objects with D in the range from 50 km to 100 km, and blue stars are objects with 30 km <D< 50 km.
Current usage metrics show cumulative count of Article Views (full-text article views including HTML views, PDF and ePub downloads, according to the available data) and Abstracts Views on Vision4Press platform.
Data correspond to usage on the plateform after 2015. The current usage metrics is available 48-96 hours after online publication and is updated daily on week days.
Initial download of the metrics may take a while.