Fig. 11
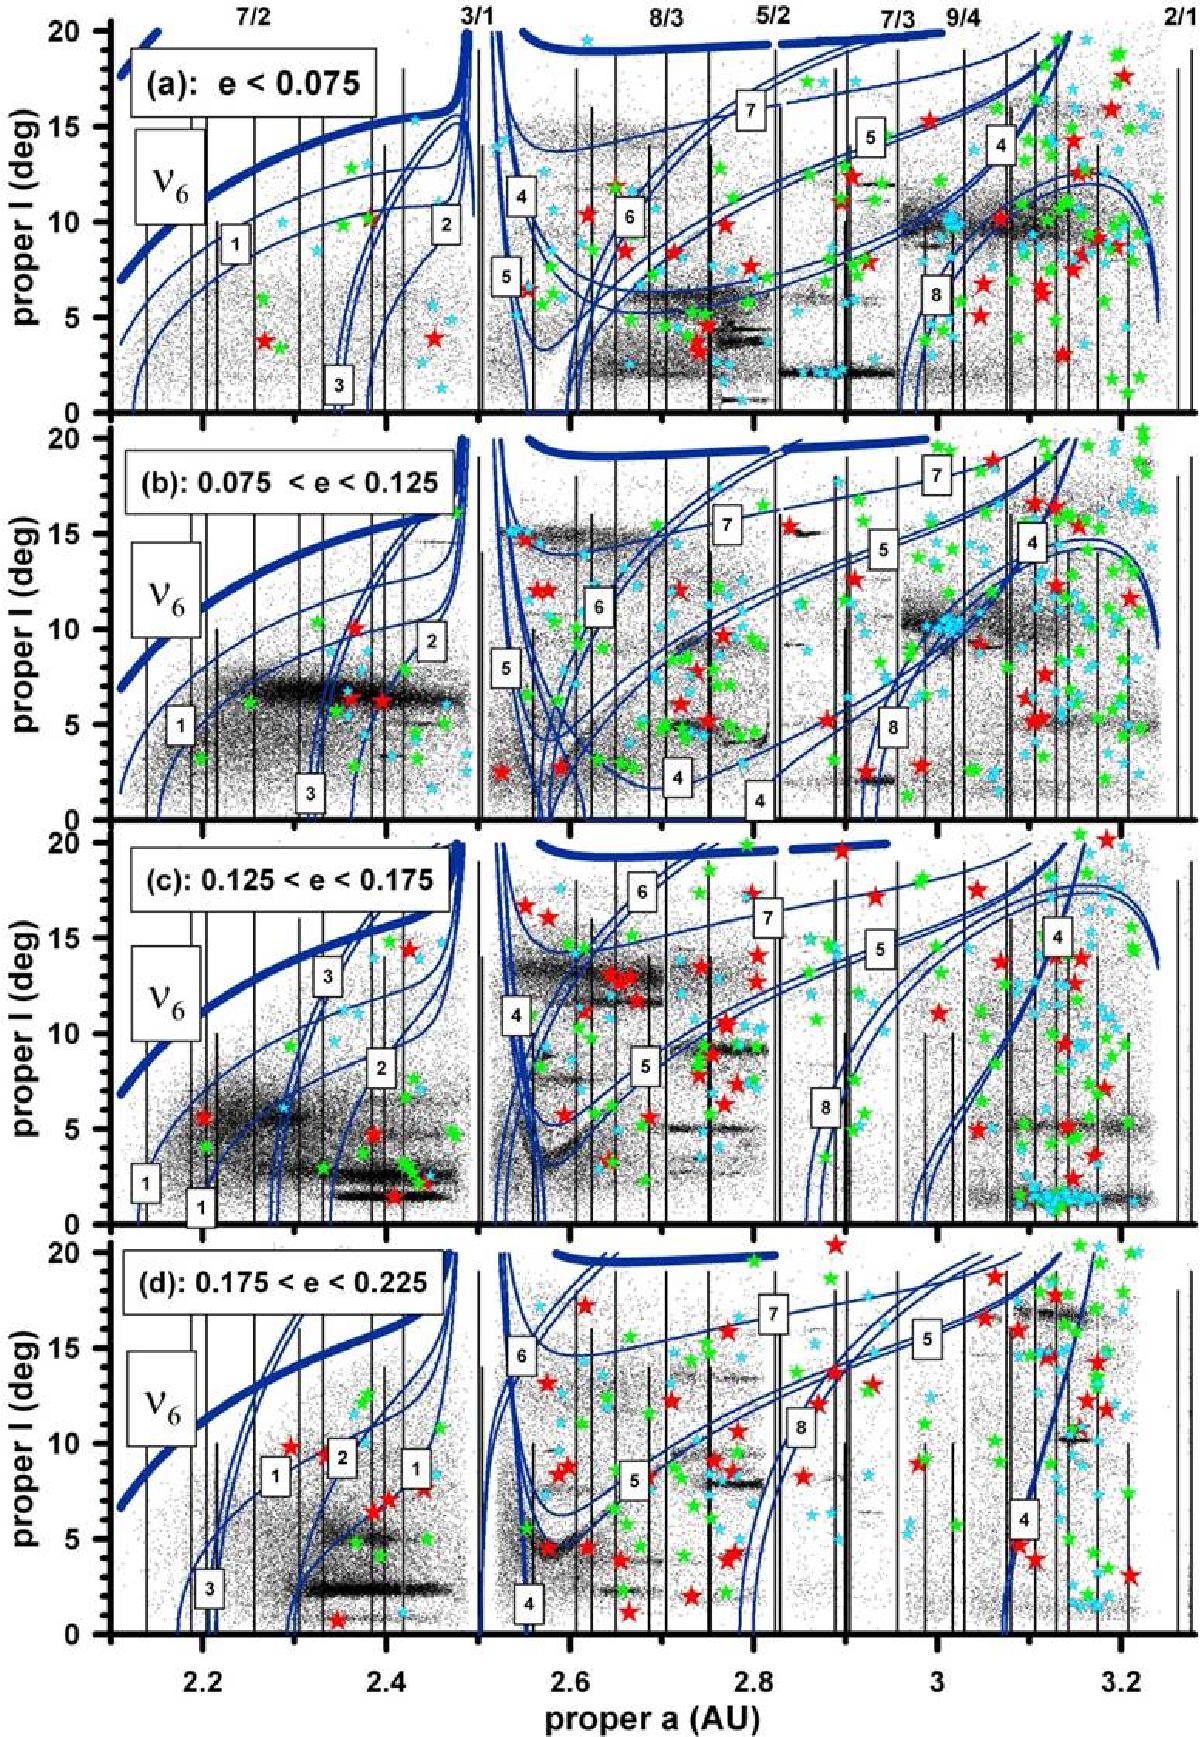
Sketch of the main MMRs (vertical lines) and the strong linear and nonlinear SRs (solid curves) in the MB. The nonlinear SRs are identified by the group number from Table A.2. The dots indicate proper elements of the objects within the corresponding eccentricity interval from the AstDyS catalog. The large objects from the corresponding eccentricity interval are superposed on each graph: red stars indicate objects with diameters D> 100 km, green stars indicate objects with D in the range from 50 km to 100 km, and blue stars indicate objects with 30 km <D< 50 km.
Current usage metrics show cumulative count of Article Views (full-text article views including HTML views, PDF and ePub downloads, according to the available data) and Abstracts Views on Vision4Press platform.
Data correspond to usage on the plateform after 2015. The current usage metrics is available 48-96 hours after online publication and is updated daily on week days.
Initial download of the metrics may take a while.