Fig. 1
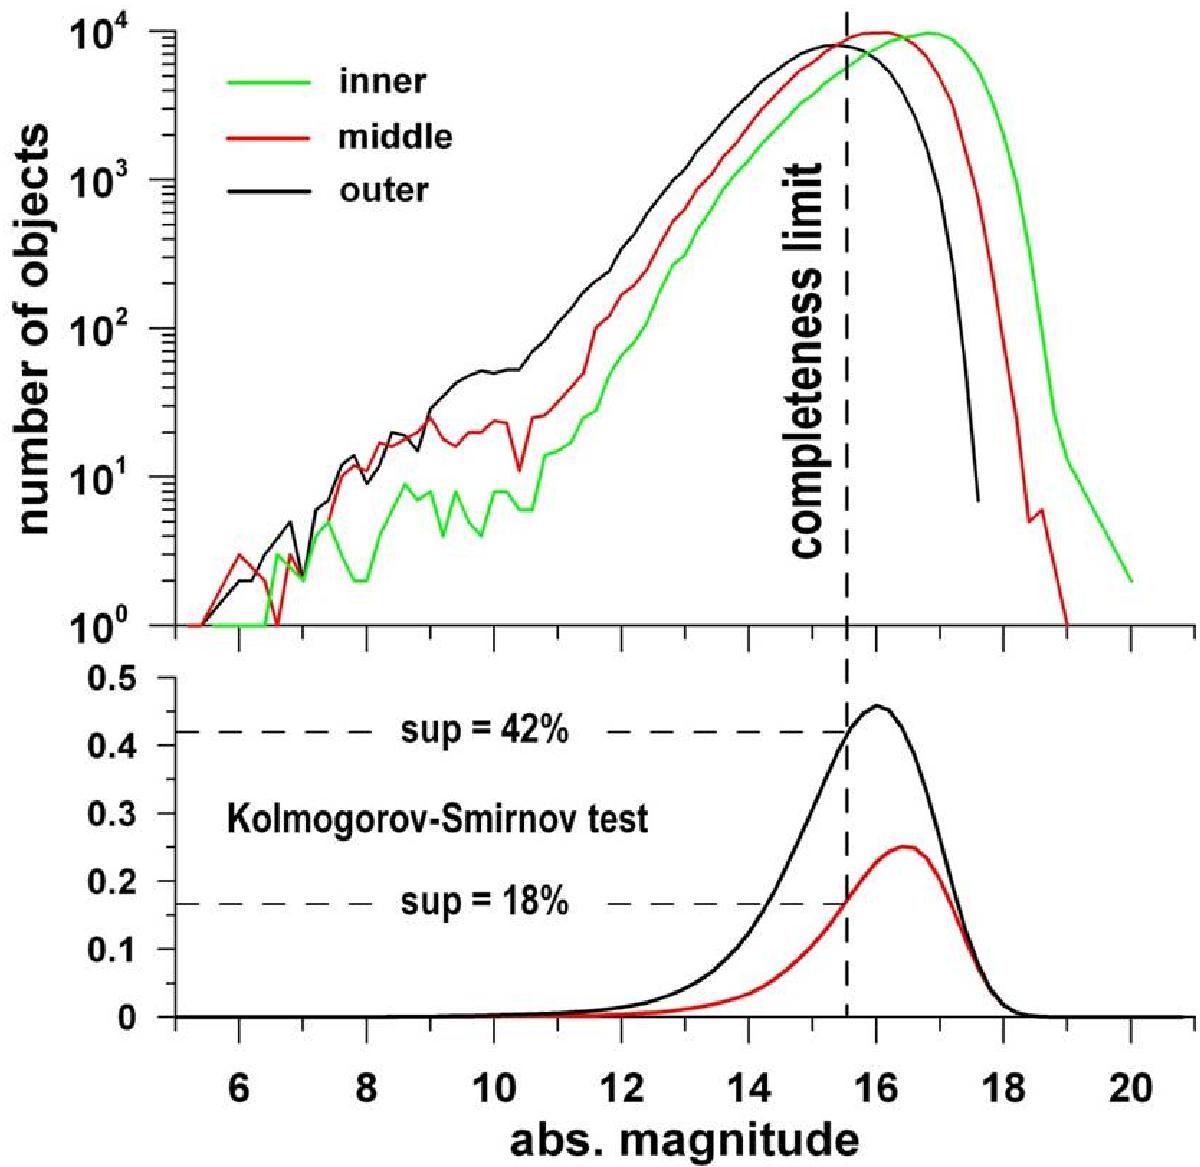
Top: number of MB objects as a function of the absolute magnitude in logarithmic scale. The different colors show different zones of the asteroid belt. Bottom: the two-sample Kolmogorov-Smirnov test; the red curve indicates the middle-inner belt comparison, while the black curve indicates the outer-inner belt comparison (for details, see text).
Current usage metrics show cumulative count of Article Views (full-text article views including HTML views, PDF and ePub downloads, according to the available data) and Abstracts Views on Vision4Press platform.
Data correspond to usage on the plateform after 2015. The current usage metrics is available 48-96 hours after online publication and is updated daily on week days.
Initial download of the metrics may take a while.