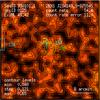
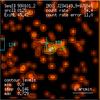
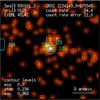
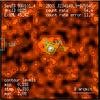
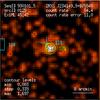
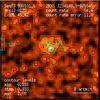
Fig. 3

Example of X-ray count rate images for our six energy bands with overlaid X-ray intensity contours (black lines), bands 1 to 6 are defined as PSPC channels 11−41, 52−90, 91−201, 11−235, 52−201, 11−201, respectively (with one channel ~ 10 eV). Each image is centred on source 125 for which the 2RXS IAU name is provided. The broad-band source count rate (PSPC channels 11−235) with error as determined from the detection algorithm is in units of counts ks-1. Contour levels are in units of counts ks-1 arcmin-2. At the top of the image the field number (SeqID) and the source identification within the field (srcID) are given. The green circles gives the catalogue entries, and the cyan cross marks a source that was visually flagged in the screening process.
Current usage metrics show cumulative count of Article Views (full-text article views including HTML views, PDF and ePub downloads, according to the available data) and Abstracts Views on Vision4Press platform.
Data correspond to usage on the plateform after 2015. The current usage metrics is available 48-96 hours after online publication and is updated daily on week days.
Initial download of the metrics may take a while.