Fig. 13
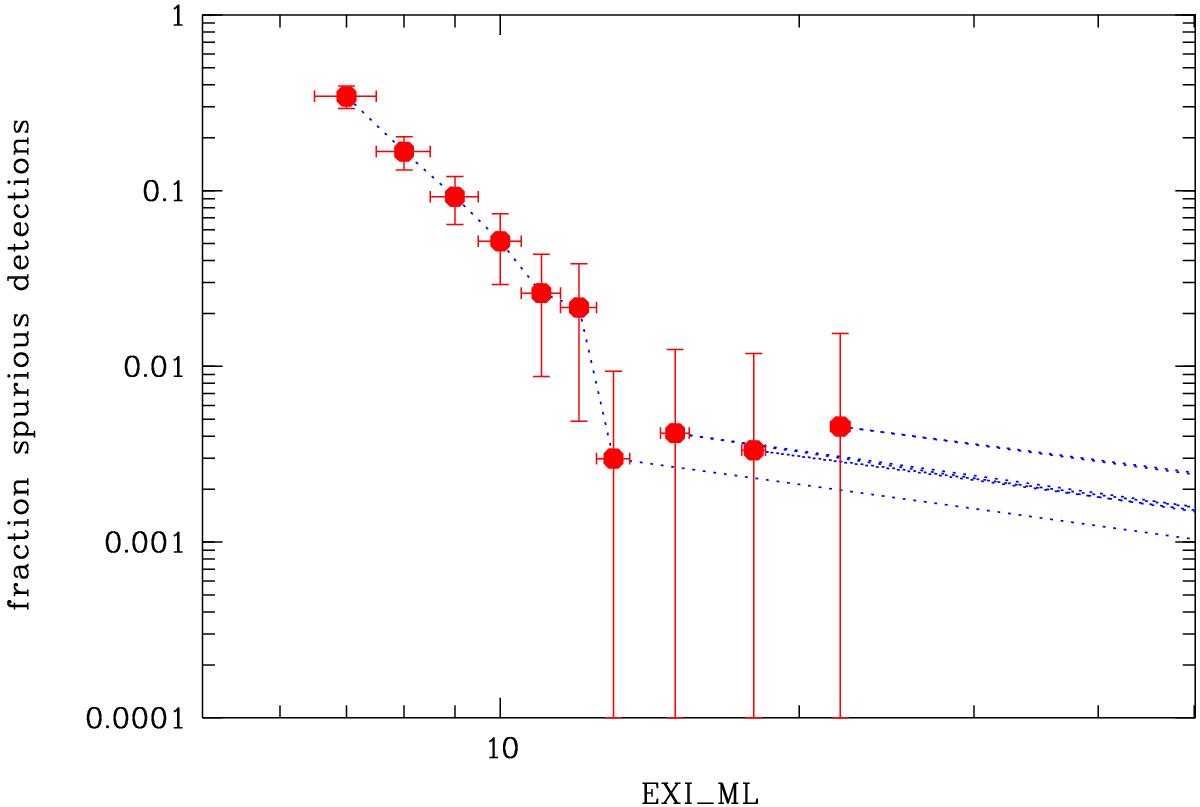
Fraction of spurious X-ray detections as a function of detection likelihood for exposure times greater than 4000 s. The differential fraction of spurious detections in the lowest bin decreases to about 30 per cent. This plot has to be compared with the lower panel of Fig. 12, which shows the fraction of spurious sources for the whole sky (excluding fields that have been masked).
Current usage metrics show cumulative count of Article Views (full-text article views including HTML views, PDF and ePub downloads, according to the available data) and Abstracts Views on Vision4Press platform.
Data correspond to usage on the plateform after 2015. The current usage metrics is available 48-96 hours after online publication and is updated daily on week days.
Initial download of the metrics may take a while.