| Issue |
A&A
Volume 587, March 2016
|
|
|---|---|---|
| Article Number | A121 | |
| Number of page(s) | 9 | |
| Section | Catalogs and data | |
| DOI | https://doi.org/10.1051/0004-6361/201527742 | |
| Published online | 29 February 2016 | |
Spitzer mid-infrared point sources in the fields of nearby galaxies⋆,⋆⋆
1
Department of PhysicsUniversity of Crete,
71003
Heraklion,
Greece
e-mail:
williams@physics.uoc.gr
2
IAASARS, National Observatory of Athens,
15236
Penteli,
Greece
Received: 13 November 2015
Accepted: 23 December 2015
Aims. To complement the study of transient phenomena and to assist subsequent observations in the mid-infrared, we extract point source photometry from archival mosaics of nearby galaxies with high star formation rates within 4 Mpc.
Methods. Point spread function photometry was performed on sources detected in both Spitzer IRAC 3.6 μm and 4.5 μm bands at greater than 3σ above background. These data were then supplemented by aperture photometry in the IRAC 5.8 μm and 8.0 μm bands conducted at the positions of the shorter wavelength sources. For sources with no detected object in the longer wavelengths, we estimated magnitude limits based on the local sky background.
Results. We present Spitzer IRAC mid-infrared point source catalogs for mosaics covering the fields of the nearby (≲4 Mpc) galaxies NGC 55, NGC 253, NGC 2366, NGC 4214, and NGC 5253. We detect a total of 20159 sources in these five fields. The individual galaxy point source breakdown is the following: NGC 55, 8746 sources; NGC 253, 9001 sources; NGC 2366, 505 sources; NGC 4214, 1185 sources; NGC 5253, 722 sources. The completeness limits of the full catalog vary with bandpass and were found to be m3.6 = 18.0, m4.5 = 17.5, m5.8 = 17.0, and m8.0 = 16.5 mag. For all galaxies, this corresponds to detection of point sources brighter than M3.6 = −10. These catalogs can be used as a reference for stellar population investigations, individual stellar object studies, and in planning future mid-infrared observations with the James Webb Space Telescope.
Key words: catalogs / galaxies: stellar content / stars: massive
Based on observations made with the Spitzer Space Telescope, which is operated by the Jet Propulsion Laboratory, California Institute of Technology under a contract with NASA.
Full Tables 2–6 are only available at the CDS via anonymous ftp to cdsarc.u-strasbg.fr (130.79.128.5) or via http://cdsarc.u-strasbg.fr/viz-bin/qcat?J/A+A/587/A121
© ESO, 2016
1. Introduction
Understanding the resolved stellar populations of nearby galaxies is vital to understanding the integrated light of more distant galaxies. Extrapolating the properties of local, resolved stellar populations is one method by which the properties of the first generation of stars can be investigated (Sobral et al. 2015). Other examples of the benefits of studying resolved stellar populations range from constraining the formation and evolution of compact objects (Lehmer et al. 2014) to identifying the progenitors and environments of supernovae (SNe) and other transients (e.g., Prieto et al. 2008).
The examination of individual stars in nearby galaxies can also provide insight into stellar evolutionary theory. The most luminous point sources will typically be the most massive evolved stars (Hosek et al. 2014). The characterization of these sources sheds light on an otherwise poorly understood area of modern stellar astrophysics. The later stages of evolution for massive stars can produce copious amounts of intervening circumstellar material, making observations difficult or impossible in optical bands (Gvaramadze et al. 2010; Wachter et al. 2010; Khan et al. 2015a). Taking advantage of the largely untapped potential for individual stellar investigations in the local universe with mid-infrared (mid-IR) Spitzer archival data, several forays into the stellar content of the Local Group members (Mould et al. 2008; Bonanos et al. 2009, 2010; Thompson et al. 2009) were performed. Investigations subsequently expanded to more distant galaxies. For instance, Khan et al. (2013) searched for η Carinae analogs, uncovered an emerging class of evolved massive stars (Khan et al. 2015b), and later discovered several η Carinae analogs (Khan et al. 2015a). Williams et al. (2015) extracted photometry from archival Spitzer Infrared Array Camera (IRAC) images of the galaxy M83 and used color-magnitude diagrams (CMD) of 3.6 μm and 4.5 μm photometry to identify red supergiant (RSG) candidates. Mid-IR photometric candidates of this kind have been shown via spectroscopic follow up to indeed be RSGs (late-type stars with zero age main sequence mass between ~8 and ~30 M⊙) by Britavskiy et al. (2014, 2015).
Properties of target galaxies.
The aim of our work here is to continue to stockpile mid-IR point source catalogs for nearby galaxies and their fields. Khan et al. (2015c) presented catalogs of point sources in seven nearby galaxies (M33, M81, NGC 247, NGC 300, NGC 2403, NGC 6822, and NGC 7793) from mid-IR Spitzer archival observations. These catalogs can be used for stellar population investigations, individual stellar object studies, and as a reference for planning future mid-IR observations with the James Webb Space Telescope (JWST; Gardner et al. 2006).
We start with a discussion concerning our target selection in Sect. 2, then we outline our photometric analysis procedure in Sect. 3, and describe the catalogs in Sect. 4. Finally, we wrap up the paper in Sect. 5 with a summary of possible applications of sources found in this work.
2. Target selection
Galaxies were chosen that met the following criteria: 1) galaxies for which point source catalogs from Spitzer are not yet published; 2) galaxies close enough (≲4 Mpc) that the resolution allows measurements of individual stars; 3) galaxies outside the Local Group; and 4) galaxies with a star formation rate listed in Kennicutt et al. (2008) with log (LHα(erg/s)) > 40. In order to ensure the homogeneity of our data set, we also limited our sample to galaxies within 4 Mpc that exist in the Local Volume Legacy survey (LVL; Dale et al. 2009), which has a pixel scale of 0 75. There are a total of five galaxies meeting the above selection criteria: NGC 55, NGC 253, NGC 2366, NGC 4214, and NGC 5253. The properties of these galaxies are summarized in Table 1 and their characteristics are described below.
NGC 55 is an edge-on spiral galaxy associated with the Sculptor Group that likely is part of a gravitationally bound pair with the galaxy NGC 300 (van de Steene et al. 2006) at a Tip of the Red Giant Branch (TRGB) distance of 2.1 ± 0.1 Mpc (Tanaka et al. 2011). The proximity and size of NGC 55 make it a prime target for studies of individual stars. For example, Castro et al. (2012) spectroscopically studied several young, massive B-type supergiants likely evolving toward the RSG phase in NGC 55.
At the core of the Sculptor Group lies NGC 253, shown in the IR to be a barred spiral of classification SAB(s)c (Jarrett et al. 2003) at 3.5 ± 0.1 Mpc (Radburn-Smith et al. 2011). Resolved individual stars in NGC 253 have been used to study the disk structure and halo (Greggio et al. 2014; Bailin et al. 2011), but evolved massive stars remain largely unstudied.
Mid-infrared Spitzer photometry of 8746 point sources in the field of NGC 55.
Mid-infrared Spitzer photometry of 9001 point sources in the field of NGC 253.
Mid-infrared Spitzer photometry of 505 point sources in the field of NGC 2366.
Mid-infrared Spitzer photometry of 1185 point sources in the field of NGC 4214.
Mid-infrared Spitzer photometry of 722 point sources in the field of NGC 5253.
NGC 2366 (DDO 42) is the closest member of the M81 Group of galaxies at a distance of ~3.2 Mpc (Karachentsev et al. 2002). It is an irregular galaxy that is a companion to NGC 2403, one of the main members of the M81 Group. One exceptional massive evolved star was revealed to be a luminous blue variable in outburst by Drissen et al. (2001), while the broader stellar population of Hubble Space Telescope (HST) imaging fields revealed a few evolved massive star candidates (Thuan & Izotov 2005; Tikhonov & Galazutdinova 2008).
NGC 4214 is a dwarf irregular Magellanic-type galaxy in the direction of the Canes Venatici cloud at a distance of 2.7 ± 0.3 Mpc (Drozdovsky et al. 2002). HST observations of NGC 4214 (Úbeda et al. 2007a) resolved individual massive evolved stars and found a steep initial mass function for stars above 20 M⊙ with several RSG and blue supergiant candidates (Úbeda et al. 2007b).
Finally, NGC 5253 is a blue compact dwarf galaxy in the M83 Group at a distance of 3.6 ± 0.2 Mpc (Sakai et al. 2004). The central region of NGC 5253 shows evidence for a recent starburst and large numbers of young massive stars (Crowther et al. 1999).
3. Photometry
The photometric analysis of the data made use of the DAOPHOT (Stetson 1987, 1992) package in IRAF1. We began by following the routine described in Williams et al. (2015) for the 3.6 μm and 4.5 μm mosaics separately. We first detected point sources, then constructed a point-spread function (PSF) from bright, isolated stars. In the LVL catalog, the 3.6 μm and 4.5 μm mosaics for the chosen galaxies do not overlap exactly, meaning it was necessary to use different PSF stars for the two bandpasses. PSF photometry was then performed on the entirety of the point source catalogs. For the PSF stars, aperture photometry was converted to the Vega system using the aperture corrections and zero-point fluxes listed in the IRAC Instrument Handbook2. For the aperture photometry, we used a 36 aperture radius, with the sky annulus beginning at the edge of the aperture radius and ending at a radius of 84. The offset between this calibrated aperture photometry and the PSF photometry was then applied to the entire data set. The Vega-calibrated PSF data sets in the 3.6 μm and 4.5 μm catalogs were then coordinate-matched using J. D. Smith’s match_2d.pro3. Khan et al. (2015c) investigated the best coordinate matching radius for their Spitzer 3.6 μm and 4.5 μm catalogs. They found that the majority of sources (>90%) are matched within one half pixel, with virtually all reasonable matches lying within one pixel. Therefore, the matching criteria employed here uses a radius of one pixel, or 075. The final coordinates adopted for our catalog come from the image header World Coordinate Systems in 3.6 μm mosaics.
After coordinate matching the two shortest wavelength bands, we proceed to add to the catalog aperture photometry in the 5.8 μm and 8.0 μm at the coordinates determined from the 3.6 μm band. For instances where there is no object in either of these bands, we use the local sky background, which was measured at the position of the detection in the 3.6 μm band, to determine the limit of the magnitude. These instances amounted to 3374 mag limits in the 5.8 μm band and 5107 similarly measured objects in the 8.0 μm band. These data were also calibrated by applying appropriate constants from the IRAC Instrument Handbook, with the same extraction apertures and sky annuli as for PSF stars in order to calibrate the data for the 3.6 μm and 4.5 μm bands (an aperture radius of 36 and sky annulus of 48).
The LVL survey (Dale et al. 2009) created mosaic images of galaxies constructed from a number of exposures in the fields of each galaxy. Because of this, exposure times differed on a pixel-by-pixel basis. Their “coverage maps” for each galaxy list a representative exposure time for each pixel in the mosaic. For NGC 55, NGC 2366, and NGC 4214, these exposure times are on average 500 s for pixels close to the particular galaxy. For NGC 253, the exposure times range between 300 and 500 s, with most pixels being closer to 500 s. However, for the NGC 5253 mosaic, the average exposure times are closer to 300 s. This may, in some regard, mean the catalog for NGC 5253 is not as deep as those for the other galaxies.
4. Point source lists
The total number of point sources is 20159, with 8746 sources in NGC 55 (Table 2), 9001 sources in NGC 253 (Table 3), 505 sources in NGC 2366 (Table 4), 1185 sources in NGC 4214 (Table 5), and 722 sources in NGC 5253 (Table 6). Tables 2 through 6 are available in their entirety at the CDS, but a portion of the point source catalog for each individual galaxy is shown here. The columns of the tables are uniform and include the RA and Dec (J2000) in degrees followed by the PSF magnitudes and associated uncertainties for the 3.6 μm and 4.5 μm bands, with the last four columns containing the aperture photometry and uncertainties in the 5.8 μm and 8.0 μm bandpasses. Our uncertainty estimates come from the DAOPHOT PSF-fitting or sky annuli for aperture photometry and do not include calibration uncertainties. According to the Spitzer instrument handbook, typical calibration uncertainties are on the order of ~0.03 mag. Each table is sorted by brightness in the 3.6 μm band. For any measurement in the 5.8 μm or 8.0 μm bands that represents a non-detection, an uncertainty of “9.99” is listed in order to denote the estimate as a limit.
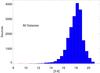 |
Fig. 1 Histogram showing the detected sources per half magnitude bin for the entire sample of 20159 sources across all five galaxies in the Spitzer IRAC 3.6 μm band. The limiting magnitude is estimated to be where the histogram turns over, at m[ 3.6 ] = 18.0. |
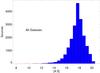 |
Fig. 2 Same as Fig. 1 but in the Spitzer IRAC 4.5 μm band. The limiting magnitude is estimated to be where the histogram turns over, at m[ 4.5 ] = 17.5. |
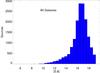 |
Fig. 3 Same as Fig. 1 but in the Spitzer IRAC 5.8 μm band, with 3949 sources removed that were not recovered in this bandpass. The limiting magnitude is estimated to be where the histogram turns over, at m[ 5.8 ] = 17.0. |
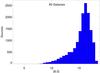 |
Fig. 4 Same as Fig. 1 but in the Spitzer IRAC 8.0 μm band, with 5022 sources removed that were not recovered in this bandpass. The limiting magnitude is estimated to be where the histogram turns over, at m[ 8.0 ] = 16.5. |
The catalogs list any point source meeting our criteria from Sect. 3. To estimate the completeness of the catalogs, we constructed a histogram of photometry from all galaxies in each bandpass for half-magnitude bins. Because the number of sources should scale with the volume sampled, and the volume sampled should scale according to the limiting luminosity, one expects a histogram to roughly follow a power law of order 3. Therefore, 100% completeness is lost where the histogram drops off from this power law. Figures 1 through 4 show the histogram distributions for the 3.6 μm through 8.0 μm bandpasses. In each case, the drop off in the increase of detected sources is obvious, and we estimate the limiting magnitudes of the catalogs to be m[ 3.6 ] = 18.0, m[ 4.5 ] = 17.5, m[ 5.8 ] = 17.0, and m[ 8.0 ] = 16.5, corresponding to an average absolute magnitude for the galaxies of M3.6 = −9.3, M4.5 = −9.8, M5.8 = −10.3, and M8.0 = −10.8. These limits are consistent with those found for other nearby galaxies (Khan et al. 2015c).
We can compare the number of sources detected for our galaxies to the numbers detected by Khan et al. (2015c). Initially, it is clear that there are fewer sources detected in our galaxies than in those from the study by Khan et al. (2015c). This is likely due to the interplay of several factors. First, the mosaics analyzed by Khan et al. (2015c) typically cover a larger area of the sky than those studied here (compare Table 1 in Khan et al. 2015c to our Table 1). Second, a greater distance to a particular galaxy will mean fewer detected point sources, as is the case with NGC 7793 (at a distance of ~4.1 Mpc) in Khan et al. (2015c). The last main factor in the difference is due to the orientation and physical size of the galaxy in question. Both NGC 55 and NGC 253, the galaxies with the two highest number of point sources in our study, are highly inclined to our line of sight. This means less projected area on the sky for these galaxies, and fewer detected point sources. These galaxies are also intrinsically smaller in size, containing fewer stars, than M81, for example. In short, intrinsically smaller galaxies, at higher inclination angles to our line of sight, at on average larger distances, with mosaics covering smaller areas on the sky mean fewer detected point sources.
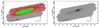 |
Fig. 5 Spitzer IRAC 3.6 μm image of NGC 55 both with and without. Axes are labeled in units of degrees. Red points show locations of sources, while green dots show sources within our estimate of the galaxy’s isophotal borders based initially upon the Kron radius described in the 2MASS Large Galaxy Atlas (Jarrett et al. 2003). For reference, also shown are a compass indicating the orientation of the image and a bar of length 10 arcmin. |
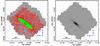 |
Fig. 6 Spitzer IRAC 3.6 μm image of NGC 253. Axes are labeled in units of degrees. Red points show locations of sources, while green dots show sources within our estimate of the galaxy’s isophotal borders based initially upon the Kron radius described in the 2MASS Large Galaxy Atlas (Jarrett et al. 2003). For reference, also shown are a compass indicating the orientation of the image and a bar of length 10 arcmin. |
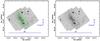 |
Fig. 7 Spitzer IRAC 3.6 μm image of NGC 2366. Axes are labeled in units of degrees. Red points show locations of sources, while green dots show sources within our estimate of the galaxy’s isophotal borders based initially on isophotes described in de Vaucouleurs et al. (1991). For reference, also shown are a compass indicating the orientation of the image and a bar of length 10 arcmin. |
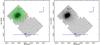 |
Fig. 8 Spitzer IRAC 3.6 μm image of NGC 4214. Axes are labeled in units of degrees. Red points show locations of sources, while green dots show sources within our estimate of the galaxy’s isophotal borders based initially upon the Kron radius described in the 2MASS Large Galaxy Atlas (Jarrett et al. 2003). For reference, also shown are a compass indicating the orientation of the image and a bar of length 10 arcmin. It should be noted that the 4.5 μm image only overlaps with the galaxy itself, thus the large portion of this image with no labeled sources. |
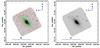 |
Fig. 9 Spitzer IRAC 3.6 μm image of NGC 5253. Axes are labeled in units of degrees. Red points show locations of sources, while green dots show sources within our estimate of the galaxy’s isophotal borders based initially upon the Kron radius described in the 2MASS Large Galaxy Atlas (Jarrett et al. 2003). For reference, also shown are a compass indicating the orientation of the image and a bar of length 5 arcmin. |
Williams et al. (2015) investigated the stellar content of M83, removing sources that were not associated with the galaxy or were known to not be stellar in nature (proper motion stars, clusters, supernova remnants, and so on). Here, we are interested in simply cataloging the point sources matched between the two shortest wavelength IRAC bands. To illustrate the locations of detected sources in our catalog, we present in Figs. 5 through 9 the 3.6 μm image of each galaxy with the positions of detected sources overplotted, followed by an image of the galaxy without sources shown. For each galaxy, red points denote the location of point sources not likely to be associated with the galaxy, while green points demarcate the regions inside isophotes for the Kron radius for all galaxies but NGC 2366, where the isophote described in de Vaucouleurs et al. (1991) was used. Consequently, the green points are more probably actual sources associated with each galaxy.
Figures 10 through 14 show color-magnitude diagrams (CMDs) of [3.6] versus [3.6]−[4.5] for each galaxy. The points follow the color scheme from the images showing each galaxy, with green points representing sources within the isophotes for with each galaxy, and red points sources in the field of each galaxy. For each magnitude bin, the average uncertainty was computed for both the [3.6] magnitude and [3.6]−[4.5] color, and is plotted as an ellipse on the left hand side of the plot. For reference, lines are drawn to show the completeness limit of m[ 3.6 ] = 18.0 mag and the color [3.6]−[4.5] = 0, where most stars lie in the plot. In terms of absolute magnitudes, the [3.6] limit corresponds to detections of all objects brighter than M3.6 = −10 in every galaxy. One other interesting feature in the plot was explained by Khan et al. (2015c). For both NGC 55 and NGC 253, the two galaxies with the most sources of those studied in this work, one can see a “break” at about the same magnitude as the completeness limit. This feature is representative of the two different populations in the photometry, one physically associated with the galaxy, and another simply sharing the same region of sky. Khan et al. (2015c) calls the second population “contaminants”. This population contains foreground stars near the [3.6]−[4.5] color of 0, some Milky Way Halo late-type giants and unresolved background galaxies in other regions of the CMD. Red supergiants (RSGs) have been empirically shown to exist in the region of negative color space (Bonanos et al. 2009, 2010). This is due to a suppression of the flux in the 4.5 μm photometry owing to molecular bands, most prominently CO (Verhoelst et al. 2009). However, spectroscopic investigations into the individual stellar components of Local Group dwarf irregular galaxies have discovered ~15% of new RSGs at positive colors in CMDs for those galaxies (Britavskiy et al. 2014, 2015).
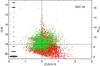 |
Fig. 10 Color−magnitude diagram for sources in the field of NGC 55. All photometrically measured sources are marked with a red dot, while those residing within the isophotal limits of the galaxy are represented by green dots. Overplotted are lines denoting the limiting magnitude of 18.0 and a [3.6]−[4.5] color of 0. On the left are ellipses corresponding to the average uncertainty for all points in every one magnitude bin. |
As an example of the utility of our catalog, the analysis of NGC 253 includes an RSG recently shown to be associated with the ultraluminous X-ray (ULX) source, RX J004722.4-252051 (Heida et al. 2015). Our photometry reveals a color of [ 3.6 ]−[ 4.5 ] = −0.43 ± 0.36, placing this object squarely in the empirical region where RSGs are known to exist. The absolute magnitude of this object is M3.6 = −9.85 again lying in the empirical RSG region, adding further, independent support to the authors’ conclusions that the counterpart is a red supergiant.
5. Summary
We present Spitzer point source catalogs for 20159 total sources with photometric measurements in the four IRAC bandpasses: 3.6 μm, 4.5 μm, 5.8 μm, and 8.0 μm. The point sources have been extracted from the LVL (Dale et al. 2009) mosaics in the fields of the galaxies NGC 55 (8746 sources), NGC 253 (9001 sources), NGC 2366 (505 sources), NGC 4214 (1185 sources), and NGC 5253 (722 sources). For all galaxies, this corresponds to detection of point sources brighter than M3.6 = −10.
The catalogs presented here can be used for a number of future works. Our particular interest lies in identifying dusty evolved massive stars such as RSGs, supergiant B[e] stars, luminous blue variables, and rare Fe emission stars for follow-up spectroscopy. Such identifications will enable a more detailed study of the stellar populations of these galaxies. This archive can also be used to plan future mid-IR observations conducted with JWST to identify and understand the nature of supernova progenitors and supernova remnants (Leonidaki et al. 2010). Finally, it will prove useful for multiwavelength studies of targets in these fields, such as X-ray binaries, as demonstrated by our identification of a mid-IR counterpart for the ULX in NGC 253.
Acknowledgments
We wish to thank the anonymous referee for a careful reading of the text and suggesting improvements to clarify the presentation of the material. S.J.W. and A.Z.B. acknowledge funding by the European Union (European Social Fund) and National Resources under the “ARISTEIA” action of the Operational Programme “Education and Lifelong Learning” in Greece. This research has made use of the VizieR catalogue access tool, CDS, Strasbourg, France. This work is based (in part) on observations made with the Spitzer Space Telescope, which is operated by the Jet Propulsion Laboratory, California Institute of Technology, under a contract with NASA.
References
- Bailin, J., Bell, E. F., Chappell, S. N., Radburn-Smith, D. J., & de Jong, R. S. 2011, ApJ, 736, 24 [NASA ADS] [CrossRef] [Google Scholar]
- Bonanos, A. Z., Massa, D. L., Sewilo, M., et al. 2009, AJ, 138, 1003 [NASA ADS] [CrossRef] [Google Scholar]
- Bonanos, A. Z., Lennon, D. J., Köhlinger, F., et al. 2010, AJ, 140, 416 [NASA ADS] [CrossRef] [Google Scholar]
- Britavskiy, N. E., Bonanos, A. Z., Mehner, A., et al. 2014, A&A, 562, A75 [NASA ADS] [CrossRef] [EDP Sciences] [Google Scholar]
- Britavskiy, N. E., Bonanos, A. Z., Mehner, A., Boyer, M. L., & McQuinn, K. B. W. 2015, A&A, 584, A33 [NASA ADS] [CrossRef] [EDP Sciences] [Google Scholar]
- Castro, N., Urbaneja, M. A., Herrero, A., et al. 2012, A&A, 542, A79 [NASA ADS] [CrossRef] [EDP Sciences] [Google Scholar]
- Crowther, P. A., Beck, S. C., Willis, A. J., et al. 1999, MNRAS, 304, 654 [NASA ADS] [CrossRef] [Google Scholar]
- Dale, D. A., Cohen, S. A., Johnson, L. C., et al. 2009, ApJ, 703, 517 [NASA ADS] [CrossRef] [Google Scholar]
- de Vaucouleurs, G., de Vaucouleurs, A., Corwin, Jr., H. G., et al. 1991, Sky and Telescope, 82, 621 [NASA ADS] [Google Scholar]
- Drissen, L., Crowther, P. A., Smith, L. J., et al. 2001, ApJ, 546, 484 [NASA ADS] [CrossRef] [Google Scholar]
- Drozdovsky, I. O., Schulte-Ladbeck, R. E., Hopp, U., Greggio, L., & Crone, M. M. 2002, AJ, 124, 811 [NASA ADS] [CrossRef] [Google Scholar]
- Gardner, J. P., Mather, J. C., Clampin, M., et al. 2006, Space Sci. Rev., 123, 485 [NASA ADS] [CrossRef] [Google Scholar]
- Greggio, L., Rejkuba, M., Gonzalez, O. A., et al. 2014, A&A, 562, A73 [NASA ADS] [CrossRef] [EDP Sciences] [Google Scholar]
- Gvaramadze, V. V., Kniazev, A. Y., & Fabrika, S. 2010, MNRAS, 405, 1047 [NASA ADS] [Google Scholar]
- Heida, M., Torres, M. A. P., Jonker, P. G., et al. 2015, MNRAS, 453, 3510 [NASA ADS] [CrossRef] [Google Scholar]
- Hosek, Jr., M. W., Kudritzki, R.-P., Bresolin, F., et al. 2014, ApJ, 785, 151 [NASA ADS] [CrossRef] [Google Scholar]
- Jarrett, T. H., Chester, T., Cutri, R., Schneider, S. E., & Huchra, J. P. 2003, AJ, 125, 525 [NASA ADS] [CrossRef] [Google Scholar]
- Karachentsev, I. D., Dolphin, A. E., Geisler, D., et al. 2002, A&A, 383, 125 [NASA ADS] [CrossRef] [EDP Sciences] [Google Scholar]
- Kennicutt, Jr., R. C. 1998, ApJ, 498, 541 [NASA ADS] [CrossRef] [Google Scholar]
- Kennicutt, Jr., R. C., Lee, J. C., Funes, José G., S. J., Sakai, S., & Akiyama, S. 2008, ApJS, 178, 247 [NASA ADS] [CrossRef] [Google Scholar]
- Khan, R., Stanek, K. Z., & Kochanek, C. S. 2013, ApJ, 767, 52 [NASA ADS] [CrossRef] [Google Scholar]
- Khan, R., Adams, S. M., Stanek, K. Z., Kochanek, C. S., & Sonneborn, G. 2015a, ApJ, 815, L18 [NASA ADS] [CrossRef] [Google Scholar]
- Khan, R., Kochanek, C. S., Stanek, K. Z., & Gerke, J. 2015b, ApJ, 799, 187 [NASA ADS] [CrossRef] [Google Scholar]
- Khan, R., Stanek, K. Z., Kochanek, C. S., & Sonneborn, G. 2015c, ApJS, 219, 42 [NASA ADS] [CrossRef] [Google Scholar]
- Lehmer, B. D., Berkeley, M., Zezas, A., et al. 2014, ApJ, 789, 52 [NASA ADS] [CrossRef] [Google Scholar]
- Leonidaki, I., Zezas, A., & Boumis, P. 2010, ApJ, 725, 842 [NASA ADS] [CrossRef] [Google Scholar]
- Mould, J., Barmby, P., Gordon, K., et al. 2008, ApJ, 687, 230 [NASA ADS] [CrossRef] [Google Scholar]
- Prieto, J. L., Kistler, M. D., Thompson, T. A., et al. 2008, ApJ, 681, L9 [NASA ADS] [CrossRef] [Google Scholar]
- Radburn-Smith, D. J., de Jong, R. S., Seth, A. C., et al. 2011, ApJS, 195, 18 [NASA ADS] [CrossRef] [Google Scholar]
- Sakai, S., Ferrarese, L., Kennicutt, Jr., R. C., & Saha, A. 2004, ApJ, 608, 42 [NASA ADS] [CrossRef] [Google Scholar]
- Sobral, D., Matthee, J., Darvish, B., et al. 2015, ApJ, 808, 139 [NASA ADS] [CrossRef] [Google Scholar]
- Stetson, P. B. 1987, PASP, 99, 191 [NASA ADS] [CrossRef] [Google Scholar]
- Stetson, P. B. 1992, in Astronomical Data Analysis Software and Systems I, eds. D. M. Worrall, C. Biemesderfer, & J. Barnes, ASP Conf. Ser., 25, 297 [Google Scholar]
- Tanaka, M., Chiba, M., Komiyama, Y., Guhathakurta, P., & Kalirai, J. S. 2011, ApJ, 738, 150 [NASA ADS] [CrossRef] [Google Scholar]
- Thompson, T. A., Prieto, J. L., Stanek, K. Z., et al. 2009, ApJ, 705, 1364 [NASA ADS] [CrossRef] [Google Scholar]
- Thuan, T. X., & Izotov, Y. I. 2005, ApJ, 627, 739 [NASA ADS] [CrossRef] [Google Scholar]
- Tikhonov, N. A., & Galazutdinova, O. A. 2008, Astron. Rep., 52, 19 [NASA ADS] [CrossRef] [Google Scholar]
- Úbeda, L., Maíz-Apellániz, J., & MacKenty, J. W. 2007a, AJ, 133, 917 [NASA ADS] [CrossRef] [Google Scholar]
- Úbeda, L., Maíz-Apellániz, J., & MacKenty, J. W. 2007b, AJ, 133, 932 [NASA ADS] [CrossRef] [Google Scholar]
- van de Steene, G. C., Jacoby, G. H., Praet, C., Ciardullo, R., & Dejonghe, H. 2006, A&A, 455, 891 [NASA ADS] [CrossRef] [EDP Sciences] [Google Scholar]
- Verhoelst, T., van der Zypen, N., Hony, S., et al. 2009, A&A, 498, 127 [NASA ADS] [CrossRef] [EDP Sciences] [Google Scholar]
- Wachter, S., Mauerhan, J. C., Van Dyk, S. D., et al. 2010, AJ, 139, 2330 [NASA ADS] [CrossRef] [Google Scholar]
- Williams, S. J., Bonanos, A. Z., Whitmore, B. C., Prieto, J. L., & Blair, W. P. 2015, A&A, 578, A100 [NASA ADS] [CrossRef] [EDP Sciences] [Google Scholar]
All Tables
All Figures
|
Fig. 1 Histogram showing the detected sources per half magnitude bin for the entire sample of 20159 sources across all five galaxies in the Spitzer IRAC 3.6 μm band. The limiting magnitude is estimated to be where the histogram turns over, at m[ 3.6 ] = 18.0. |
| In the text | |
|
Fig. 2 Same as Fig. 1 but in the Spitzer IRAC 4.5 μm band. The limiting magnitude is estimated to be where the histogram turns over, at m[ 4.5 ] = 17.5. |
| In the text | |
|
Fig. 3 Same as Fig. 1 but in the Spitzer IRAC 5.8 μm band, with 3949 sources removed that were not recovered in this bandpass. The limiting magnitude is estimated to be where the histogram turns over, at m[ 5.8 ] = 17.0. |
| In the text | |
|
Fig. 4 Same as Fig. 1 but in the Spitzer IRAC 8.0 μm band, with 5022 sources removed that were not recovered in this bandpass. The limiting magnitude is estimated to be where the histogram turns over, at m[ 8.0 ] = 16.5. |
| In the text | |
|
Fig. 5 Spitzer IRAC 3.6 μm image of NGC 55 both with and without. Axes are labeled in units of degrees. Red points show locations of sources, while green dots show sources within our estimate of the galaxy’s isophotal borders based initially upon the Kron radius described in the 2MASS Large Galaxy Atlas (Jarrett et al. 2003). For reference, also shown are a compass indicating the orientation of the image and a bar of length 10 arcmin. |
| In the text | |
|
Fig. 6 Spitzer IRAC 3.6 μm image of NGC 253. Axes are labeled in units of degrees. Red points show locations of sources, while green dots show sources within our estimate of the galaxy’s isophotal borders based initially upon the Kron radius described in the 2MASS Large Galaxy Atlas (Jarrett et al. 2003). For reference, also shown are a compass indicating the orientation of the image and a bar of length 10 arcmin. |
| In the text | |
|
Fig. 7 Spitzer IRAC 3.6 μm image of NGC 2366. Axes are labeled in units of degrees. Red points show locations of sources, while green dots show sources within our estimate of the galaxy’s isophotal borders based initially on isophotes described in de Vaucouleurs et al. (1991). For reference, also shown are a compass indicating the orientation of the image and a bar of length 10 arcmin. |
| In the text | |
|
Fig. 8 Spitzer IRAC 3.6 μm image of NGC 4214. Axes are labeled in units of degrees. Red points show locations of sources, while green dots show sources within our estimate of the galaxy’s isophotal borders based initially upon the Kron radius described in the 2MASS Large Galaxy Atlas (Jarrett et al. 2003). For reference, also shown are a compass indicating the orientation of the image and a bar of length 10 arcmin. It should be noted that the 4.5 μm image only overlaps with the galaxy itself, thus the large portion of this image with no labeled sources. |
| In the text | |
|
Fig. 9 Spitzer IRAC 3.6 μm image of NGC 5253. Axes are labeled in units of degrees. Red points show locations of sources, while green dots show sources within our estimate of the galaxy’s isophotal borders based initially upon the Kron radius described in the 2MASS Large Galaxy Atlas (Jarrett et al. 2003). For reference, also shown are a compass indicating the orientation of the image and a bar of length 5 arcmin. |
| In the text | |
|
Fig. 10 Color−magnitude diagram for sources in the field of NGC 55. All photometrically measured sources are marked with a red dot, while those residing within the isophotal limits of the galaxy are represented by green dots. Overplotted are lines denoting the limiting magnitude of 18.0 and a [3.6]−[4.5] color of 0. On the left are ellipses corresponding to the average uncertainty for all points in every one magnitude bin. |
| In the text | |
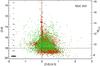 |
Fig. 11 Same as Fig. 10 but for sources in the field of NGC 253. |
| In the text | |
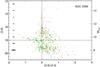 |
Fig. 12 Same as Fig. 10 but for sources in the field of NGC 2366. |
| In the text | |
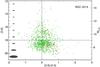 |
Fig. 13 Same as Fig. 10 but for sources in the field of NGC 4214. |
| In the text | |
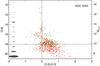 |
Fig. 14 Same as Fig. 10 but for sources in the field of NGC 5253. |
| In the text | |
Current usage metrics show cumulative count of Article Views (full-text article views including HTML views, PDF and ePub downloads, according to the available data) and Abstracts Views on Vision4Press platform.
Data correspond to usage on the plateform after 2015. The current usage metrics is available 48-96 hours after online publication and is updated daily on week days.
Initial download of the metrics may take a while.