Fig. 10
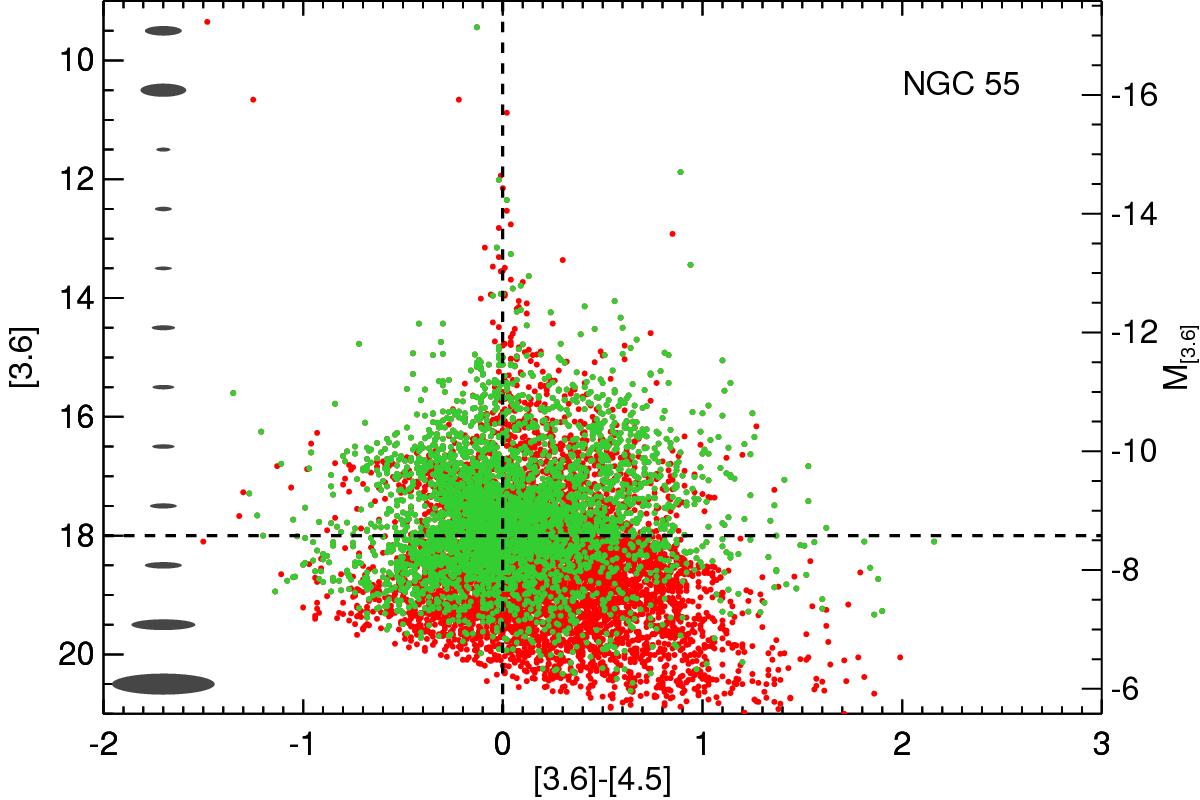
Color−magnitude diagram for sources in the field of NGC 55. All photometrically measured sources are marked with a red dot, while those residing within the isophotal limits of the galaxy are represented by green dots. Overplotted are lines denoting the limiting magnitude of 18.0 and a [3.6]−[4.5] color of 0. On the left are ellipses corresponding to the average uncertainty for all points in every one magnitude bin.
Current usage metrics show cumulative count of Article Views (full-text article views including HTML views, PDF and ePub downloads, according to the available data) and Abstracts Views on Vision4Press platform.
Data correspond to usage on the plateform after 2015. The current usage metrics is available 48-96 hours after online publication and is updated daily on week days.
Initial download of the metrics may take a while.