Fig. 6
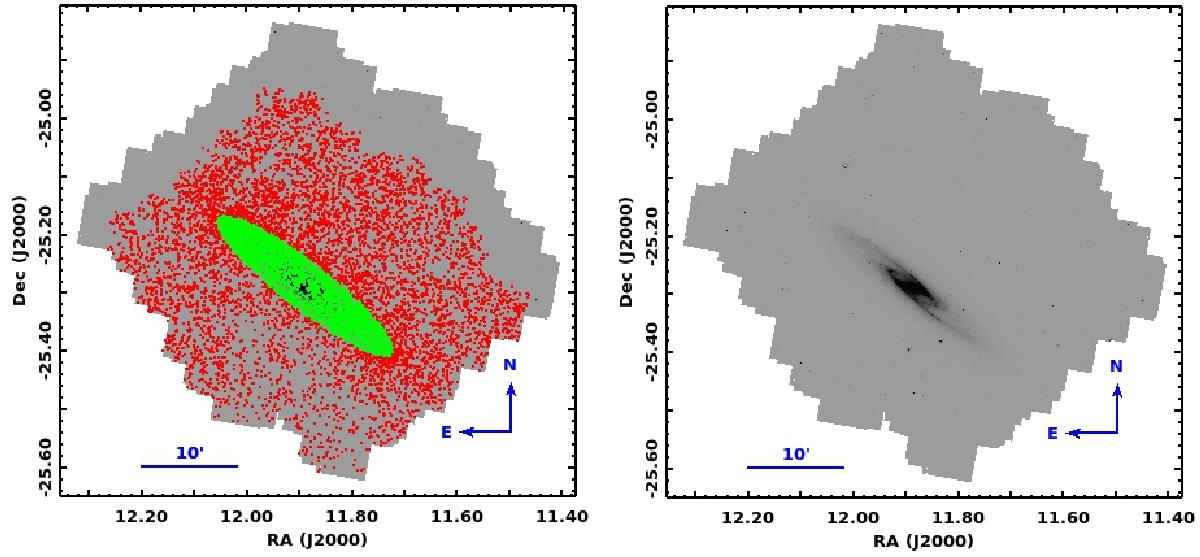
Spitzer IRAC 3.6 μm image of NGC 253. Axes are labeled in units of degrees. Red points show locations of sources, while green dots show sources within our estimate of the galaxy’s isophotal borders based initially upon the Kron radius described in the 2MASS Large Galaxy Atlas (Jarrett et al. 2003). For reference, also shown are a compass indicating the orientation of the image and a bar of length 10 arcmin.
Current usage metrics show cumulative count of Article Views (full-text article views including HTML views, PDF and ePub downloads, according to the available data) and Abstracts Views on Vision4Press platform.
Data correspond to usage on the plateform after 2015. The current usage metrics is available 48-96 hours after online publication and is updated daily on week days.
Initial download of the metrics may take a while.