Free Access
Fig. 6
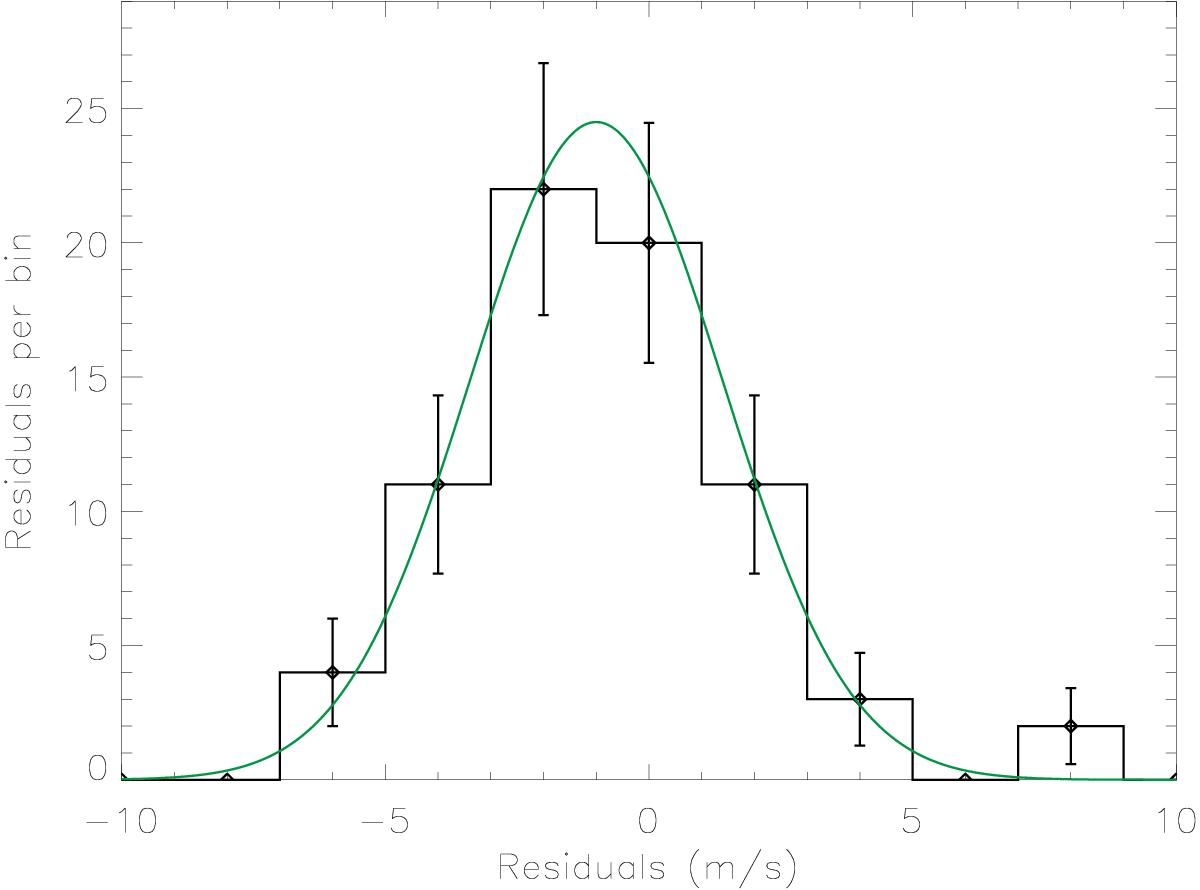
Histogram of the distribution of the residuals of the linear best fit to the RV-Ca II K correlation (solid black line). The errorbars are equal to the square root of the number of residuals in each bin. The Gaussian best fit to the distribution is superposed (green solid line).
Current usage metrics show cumulative count of Article Views (full-text article views including HTML views, PDF and ePub downloads, according to the available data) and Abstracts Views on Vision4Press platform.
Data correspond to usage on the plateform after 2015. The current usage metrics is available 48-96 hours after online publication and is updated daily on week days.
Initial download of the metrics may take a while.