Fig. 4
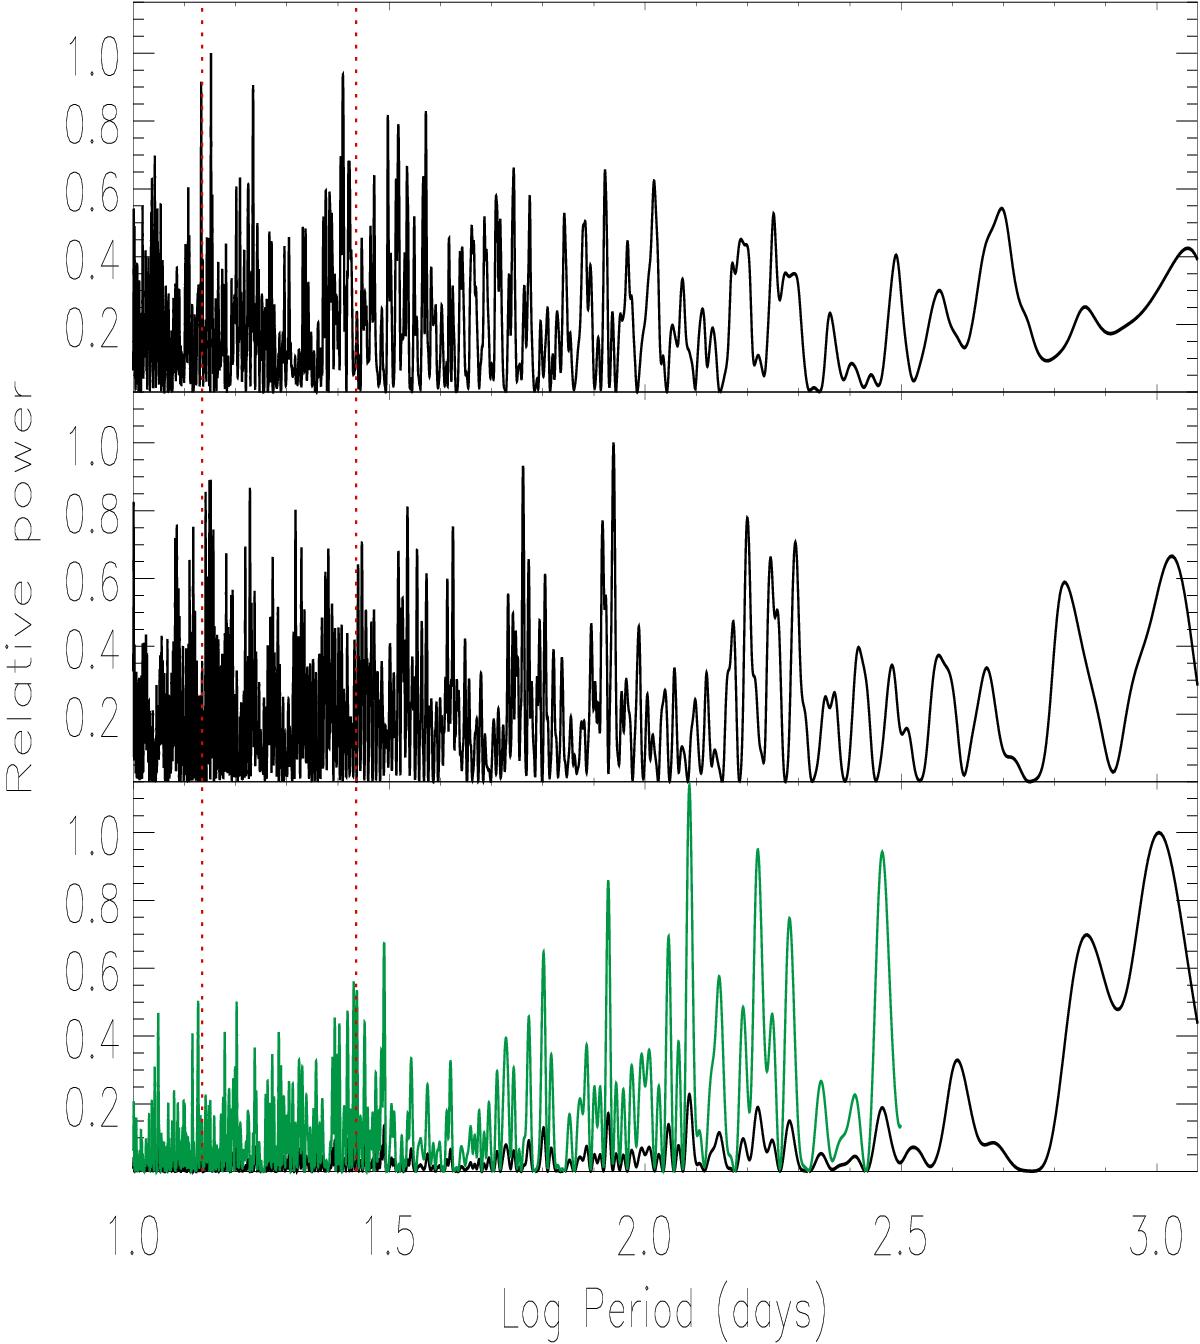
Top panel: periodogram of our RV time series. Middle panel: periodogram of the Ca II K index interpolated on the same calendar as our RV time series. Lower panel: periodogram of the Ca II K time series with an almost even cadence of one measurement per day. To allow the identification of peaks at short periods, we overplot the periodogram with an amplitude amplified by a factor of five up to a period of about 300 days (green solid line). The dotted vertical lines in the three plots indicate the solar synodic rotation period and its first harmonic, respectively.
Current usage metrics show cumulative count of Article Views (full-text article views including HTML views, PDF and ePub downloads, according to the available data) and Abstracts Views on Vision4Press platform.
Data correspond to usage on the plateform after 2015. The current usage metrics is available 48-96 hours after online publication and is updated daily on week days.
Initial download of the metrics may take a while.