Fig. 3
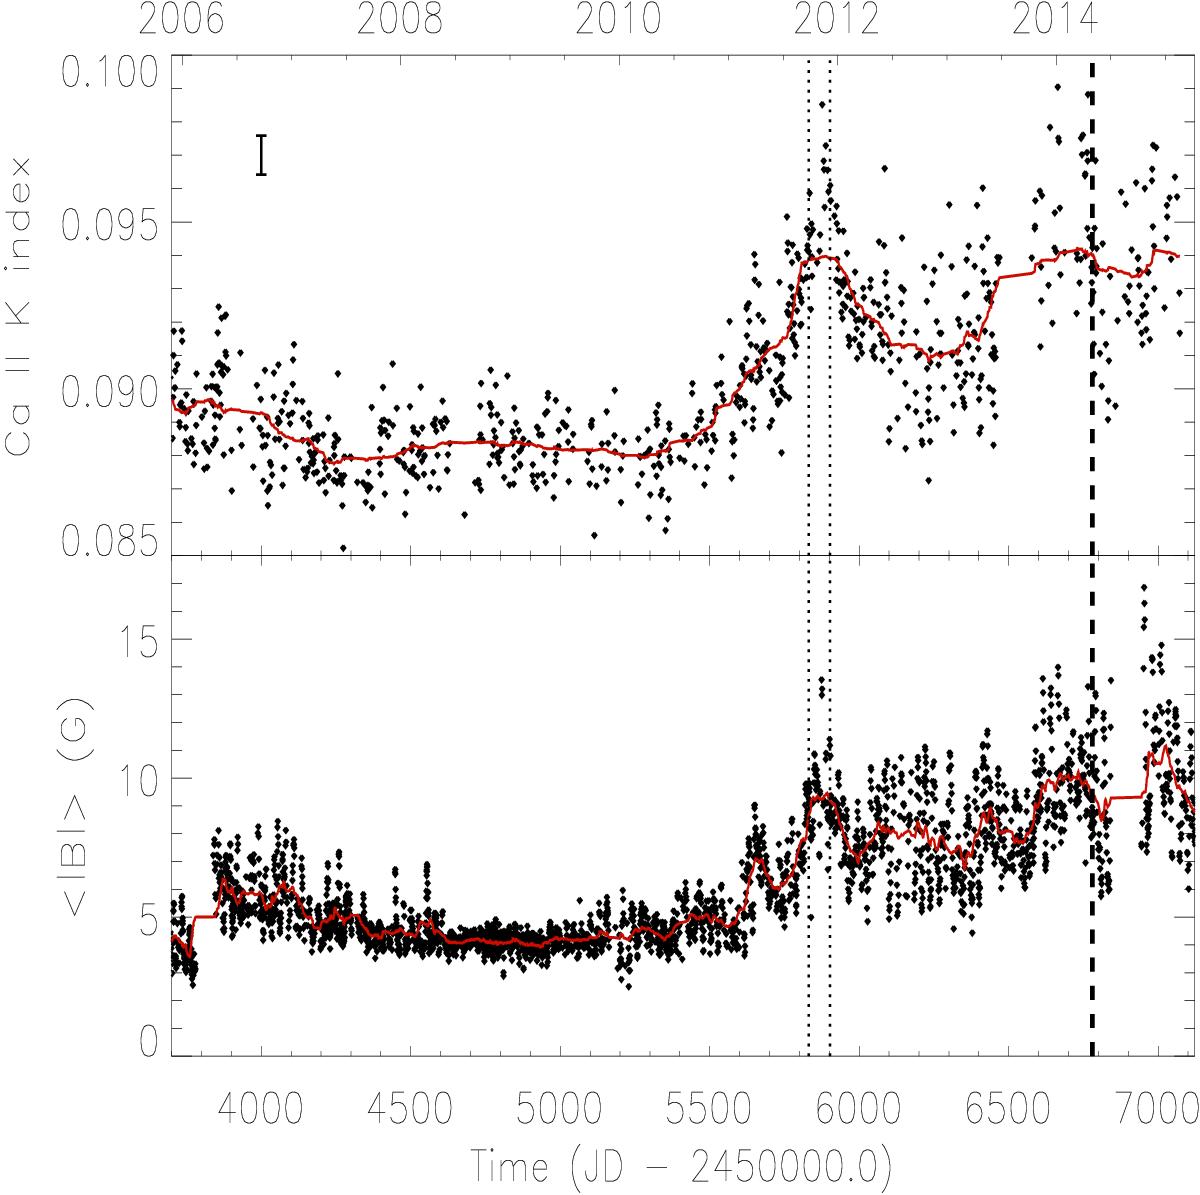
Top panel: Ca II K chromospheric index (black dots) vs. the time in JD on the lower axis and in years on the top axis. The continuous red line is obtained by smoothing the data with a time window of 60 days. The vertical dotted and dashed lines indicate the time intervals during which measurements of the RV of the Sun as a star were acquired by Haywood et al. (2016) and Dumusque et al. (2015), respectively. Lower panel: same as the upper panel, but for the total magnetic flux as measured by SOLIS VSM.
Current usage metrics show cumulative count of Article Views (full-text article views including HTML views, PDF and ePub downloads, according to the available data) and Abstracts Views on Vision4Press platform.
Data correspond to usage on the plateform after 2015. The current usage metrics is available 48-96 hours after online publication and is updated daily on week days.
Initial download of the metrics may take a while.