Fig. 1
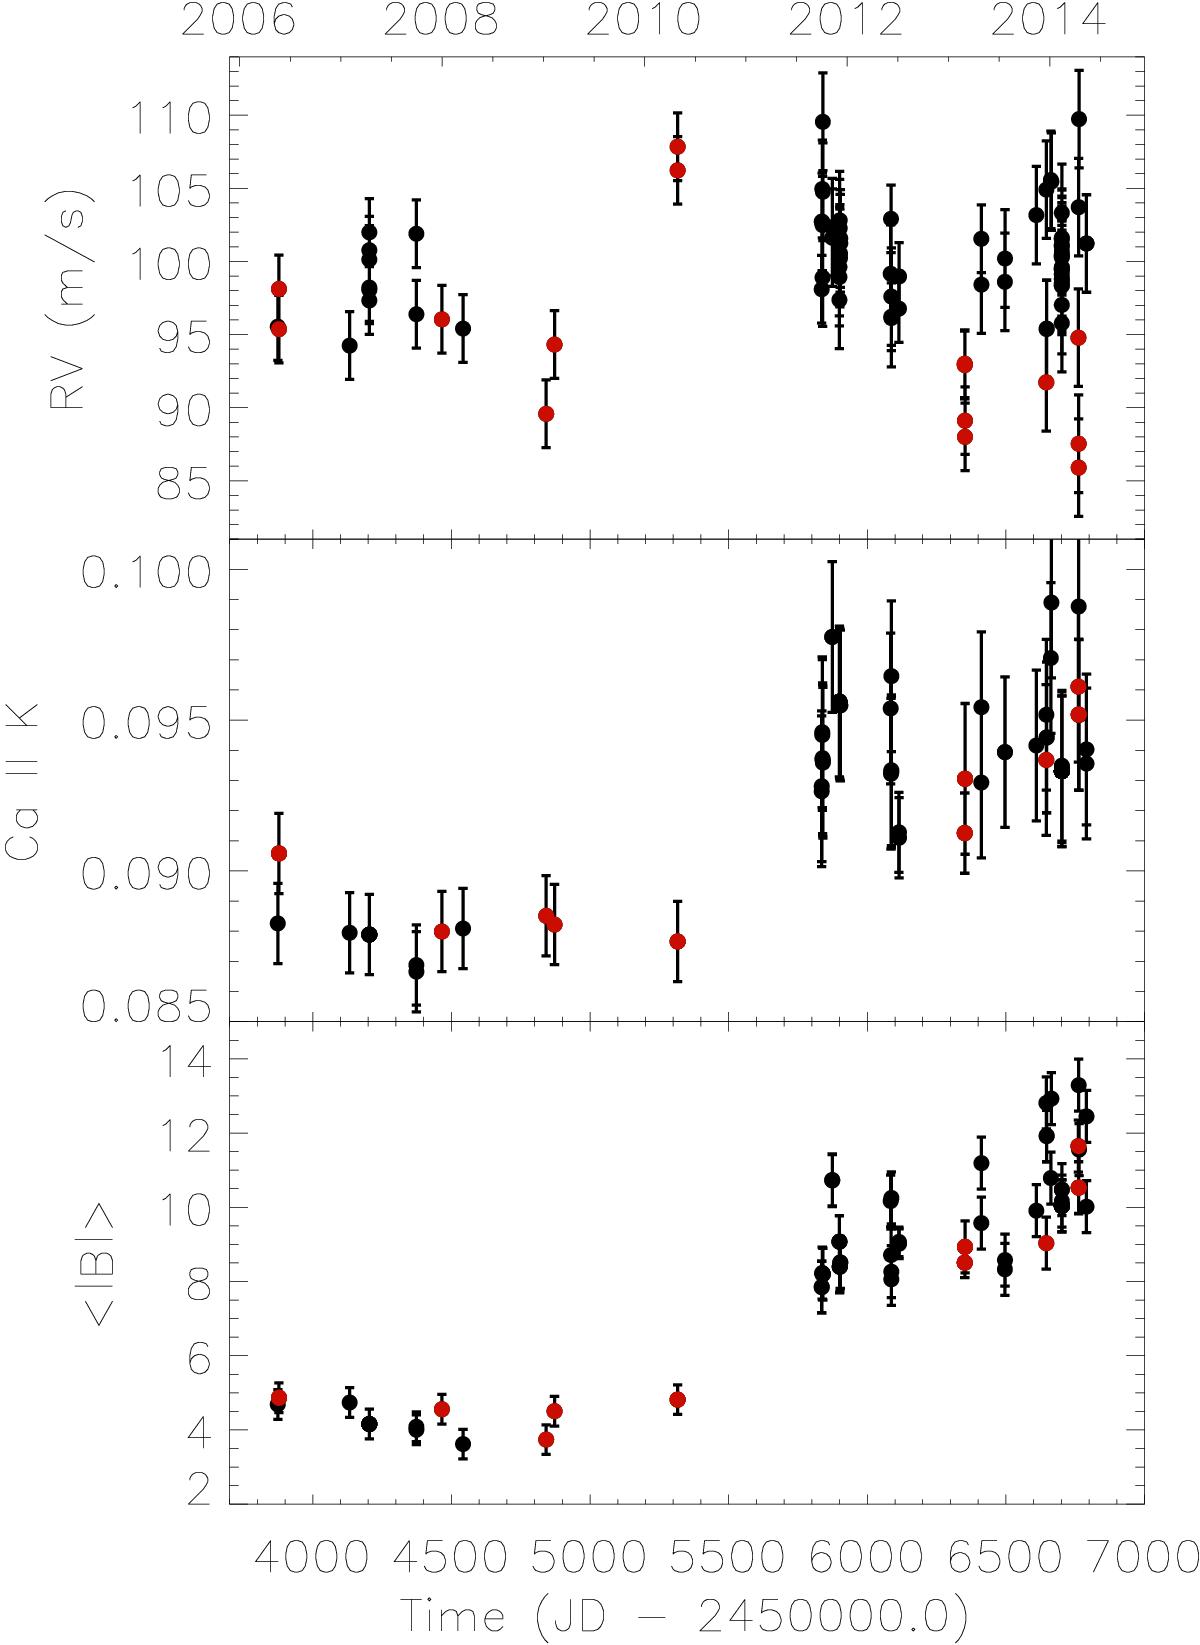
Top panel: solar RV as derived by observing different reflecting bodies vs. the time in JD on the lower axis and in years on the top axis, respectively. The errors are derived in Sect. 4.2. The red dots indicate measurements that are affected by the rotation of the reflecting body or by other systematics and that are excluded from further analysis. Middle panel: chromospheric Ca II K index corresponding to our RV measurements vs. the time (see Sect. 2.2). The red dots indicate the excluded data points as in the top panel, while the errors are derived in Sect. 2.3. Lower panel: same as the middle panel, but for the total mean magnetic flux introduced in Sect. 2.2 and whose errors are derived in Sect. 2.3.
Current usage metrics show cumulative count of Article Views (full-text article views including HTML views, PDF and ePub downloads, according to the available data) and Abstracts Views on Vision4Press platform.
Data correspond to usage on the plateform after 2015. The current usage metrics is available 48-96 hours after online publication and is updated daily on week days.
Initial download of the metrics may take a while.