| Issue |
A&A
Volume 587, March 2016
|
|
|---|---|---|
| Article Number | A91 | |
| Number of page(s) | 66 | |
| Section | Interstellar and circumstellar matter | |
| DOI | https://doi.org/10.1051/0004-6361/201527268 | |
| Published online | 23 February 2016 | |
Exploring molecular complexity with ALMA (EMoCA): Deuterated complex organic molecules in Sagittarius B2(N2)
1
Max-Planck-Institut für Radioastronomie, Auf dem Hügel 69, 53121
Bonn, Germany
e-mail: This email address is being protected from spambots. You need JavaScript enabled to view it.
2
I. Physikalisches Institut, Universität zu Köln,
Zülpicher Str. 77, 50937
Köln,
Germany
3
Depts. of Astronomy and Chemistry, University of
Virginia, Charlottesville, VA
22904,
USA
Received:
28
August
2015
Accepted:
16
November
2015
Abstract
Context. Deuteration is a powerful tracer of the history of the cold prestellar phase in star-forming regions. Apart from methanol, little is known about deuterium fractionation of complex organic molecules in the interstellar medium, especially in regions forming high-mass stars.
Aims. Our goal is to detect deuterated complex organic molecules toward the high mass star-forming region Sagittarius B2 (Sgr B2) and derive the level of deuteration for these molecules.
Methods. We use a complete 3-mm spectral line survey performed with the Atacama Large Millimeter/submillimeter Array (ALMA) to search for deuterated complex organic molecules toward the hot molecular core Sgr B2(N2). We constructed population diagrams and integrated intensity maps to fit rotational temperatures and emission sizes for each molecule. Column densities are derived by modeling the full spectrum under the assumption of local thermodynamic equilibrium. We compare the results to predictions of two astrochemical models that treat the deuteration process.
Results. We report the detection of CH2DCN toward Sgr B2(N2) with a deuteration level of 0.4%, and tentative detections of CH2DOH, CH2DCH2CN, the chiral molecule CH3CHDCN, and DC3N with levels in the range 0.05%–0.12%. A stringent deuteration upper limit is obtained for CH3OD (<0.07%). Upper limits in the range 0.5–1.8% are derived for the three deuterated isotopologues of vinyl cyanide, the four deuterated species of ethanol, and CH2DOCHO. Ethyl cyanide is less deuterated than methyl cyanide by at least a factor five. The [CH2DOH]/[CH3OD] abundance ratio is higher than 1.8. It may still be consistent with the value obtained in Orion KL. Except for methyl cyanide, the measured deuteration levels lie at least a factor four below the predictions of current astrochemical models. The deuteration levels in Sgr B2(N2) are also lower than in Orion KL by a factor of a few up to a factor ten.
Conclusions. The discrepancy between the deuteration levels of Sgr B2(N2) and the predictions of chemical models, and the difference between Sgr B2(N2) and Orion KL may both be due to the higher kinetic temperatures that characterize the Galactic center region compared to nearby clouds. Alternatively, they may result from a lower overall abundance of deuterium itself in the Galactic center region by up to a factor ten.
Key words: astrochemistry / line: identification / stars: formation / ISM: individual objects: Sagittarius B2 / ISM: molecules
© ESO, 2016
1. Introduction
Deuteration is a powerful tracer of the history of the cold prestellar phase in
star-forming regions (see, e.g., Caselli & Ceccarelli
2012; Ceccarelli et al. 2014). At low
temperatures and high densities that prevail in prestellar cores, the gas-phase abundance of
H gets enhanced thanks to the depletion of its
main destroyer, CO, onto the surface of dust grains. The reaction of
H with HD, the reservoir of deuterium in
molecular clouds, produces H2D+. The exothermicity of this reaction leads to an enhancement
of the [H2D+]/[H] abundance ratio. The reaction of
H2D+ with other molecules then
transfers the deuterium to other species, producing a significant increase in their
deuterium fractionation that can reach several orders of magnitude compared to the low
cosmic abundance of deuterium with respect to hydrogen (~1.5 × 10⁻⁵, Linsky 2003). Deuteration levels, i.e., the abundance ratio [XD]/[XH] of
a deuterated molecule XD to the corresponding hydrogen-bearing molecule XH, above 10% are
commonly found in low mass star-forming regions (e.g., Parise et al. 2006). Even molecules containing several deuterium atoms have been
detected (e.g., Parise et al. 2004). Levels of
deuteration above 10% have also been found for small molecules such as ammonia in high mass
star-forming regions (Pillai et al. 2007; Fontani et al. 2015). Deuteration at somewhat higher
temperatures (~30–50 K), at
which the H2D+ channel is not efficient anymore, can also occur in the gas
phase via CH2D+ which is, like H2D+, produced by an exothermic reaction of
CH with HD (e.g., Parise et al. 2009).
gets enhanced thanks to the depletion of its
main destroyer, CO, onto the surface of dust grains. The reaction of
H with HD, the reservoir of deuterium in
molecular clouds, produces H2D+. The exothermicity of this reaction leads to an enhancement
of the [H2D+]/[H] abundance ratio. The reaction of
H2D+ with other molecules then
transfers the deuterium to other species, producing a significant increase in their
deuterium fractionation that can reach several orders of magnitude compared to the low
cosmic abundance of deuterium with respect to hydrogen (~1.5 × 10⁻⁵, Linsky 2003). Deuteration levels, i.e., the abundance ratio [XD]/[XH] of
a deuterated molecule XD to the corresponding hydrogen-bearing molecule XH, above 10% are
commonly found in low mass star-forming regions (e.g., Parise et al. 2006). Even molecules containing several deuterium atoms have been
detected (e.g., Parise et al. 2004). Levels of
deuteration above 10% have also been found for small molecules such as ammonia in high mass
star-forming regions (Pillai et al. 2007; Fontani et al. 2015). Deuteration at somewhat higher
temperatures (~30–50 K), at
which the H2D+ channel is not efficient anymore, can also occur in the gas
phase via CH2D+ which is, like H2D+, produced by an exothermic reaction of
CH with HD (e.g., Parise et al. 2009).
The overall increase in the deuterium fractionation of molecules in cold, prestellar cores leads to an abundance enhancement of atomic deuterium in the gas phase. These atoms can stick to the surface of dust grains and, in turn, participate in the deuterium fractionation of molecules already or subsequently formed on these grains, in particular of the complex organic molecules1. Once a protostar is formed, the energy it radiates heats up its circumstellar envelope and complex organic molecules desorb from the grain surfaces (e.g., Garrod et al. 2008). During this hot core phase, the relative abundance of these freshly desorbed molecules is expected to provide clues about their formation paths during the past evolution of the core. In particular, their degree of deuterium fractionation is a relic of the conditions that were prevailing in earlier, colder stages (e.g. Taquet et al. 2012, 2014; Aikawa et al. 2012).
Apart from methanol, relatively little is known about deuteration of complex organic molecules in the interstellar medium, in particular in high mass star-forming regions. A few detections or tentative detections of deuterated (complex) organic molecules have been reported toward Orion KL (Gerin et al. 1992; Daly et al. 2013; Esplugues et al. 2013; Neill et al. 2013; Coudert et al. 2013), but no systematic study of the deuteration of complex organic molecules in high mass star-forming regions has been reported so far.
Sagittarius B2, hereafter Sgr B2, is one of the most massive star-forming regions in the Galaxy. It is located in the central molecular zone, close to the Galactic center. Its current star formation rate qualifies Sgr B2 as a mini-starburst region (see, e.g., Appendix A of Belloche et al. 2013). The cloud contains several sites of ongoing, high-mass star formation. One of these sites, Sgr B2(N), contains two hot molecular cores that we designate as Sgr B2(N1) and Sgr B2(N2)2. Their angular separation is 5″ in the north-south direction, corresponding to 0.2 pc in projection at a distance of 8.3 kpc (Reid et al. 2014). Their velocities projected along the line of sight differ by 9–10 km s-1. Both are characterized by extremely high H2 column densities (>1025 cm-2 over few arcsec, see Belloche et al. 2008, 2014; Qin et al. 2011). They are both in an early stage of star formation when a (massive) protostar has already formed and started to heat up its circumstellar envelope. The high kinetic temperatures of the hot cores (~150–200 K) lead to the sublimation of molecules that formed in the ice mantles of dust grains during the prestellar phase and the warming-up period of the protostellar phase. As a result of both the high temperatures and column densities, numerous complex organic molecules have been detected toward Sgr B2(N), many of these for the first time in the interstellar medium, since the beginning of radio astronomy nearly five decades ago.
Following up a molecular line survey of Sgr B2(N) performed with the IRAM 30 m telescope that led to the first detection in space of a few new complex organic molecules (Belloche et al. 2008, 2009, 2013), we performed a systematic line survey of Sgr B2(N) in the 3-mm atmospheric window at high angular resolution and sensitivity with the Atacama Large Millimeter/submillimeter Array (ALMA) in its Cycles 0 and 1. This survey is called EMoCA, which stands for Exploring Molecular Complexity with ALMA, and it aims to investigate molecular complexity in the interstellar medium. One of the initial results of EMoCA was the first interstellar detection of a branched alkyl molecule (Belloche et al. 2014). Here, we take advantage of this sensitive survey to explore, for the first time in a systematic way, the deuterium fractionation of complex organic molecules in Sgr B2(N2). We focus on Sgr B2(N2) rather than the main hot core Sgr B2(N1) because the former has relatively narrow linewidths (~5 km s-1) at the angular resolution of EMoCA (~1.8″), while the latter still has prominent linewings like in our previous single-dish survey. A companion paper reports on the detection of alkanols and alkanethiols based on EMoCA (Müller et al. 2016b).
The article is structured as follows. The observational setup and the process of data reduction are described in Sect. 2. Section 3 explains the method employed to model the observed spectra in the approximation of local thermodynamic equilibrium (LTE) and Sect. 4 gives some details about the spectroscopic predictions used to generate the synthetic spectra. The results of the analysis are reported in Sect. 5 and discussed in Sect. 6. Section 7 gives our conclusions about deuterium fractionation of complex organic molecules in Sgr B2(N2).
2. Observations and data reduction
Observational setups of the EMoCA survey.
2.1. Observations
We used ALMA to perform a complete spectral line survey toward Sgr B2(N) between 84.1 and 114.4 GHz. The field was centered at (α,δ)J2000= (17h47m19.87s, −28°22′16′′), halfway between Sgr B2(N1) and (N2), which are separated by 4.9′′ in the north-south direction. The size (HPBW) of the primary beam of the 12 m antennas varies between 69′′ at 84 GHz and 51′′ at 114 GHz (Remijan et al. 2015).
The spectral line survey was divided into five spectral setups. Each setup was observed in one polarization and delivered four spectral windows, two per sideband. The separation between the centers of the lower and upper sidebands is 12 GHz. Each spectral window has a bandwidth of 1875 MHz and a channel spacing of 244.141 kHz, but the spectra were smoothed to a spectral resolution of 488.3 kHz (1.7 to 1.3 km s-1). Each pair of adjacent spectral windows has an overlap of about 50 MHz. Details about the frequency coverage, the date of observation, the number of antennas, the range of baselines, the on-source integration time, and the bandpass, amplitude, and phase calibrators are given in Table 1. Setups S1 to S4 were observed in Cycle 0 while setup S5 was observed in Cycle 1. As reported in Table 1, setups S1 and S5 were observed only once, but setups S2, S3, and S4 were observed on several days, between two and four times each.
2.2. Data reduction
The data was calibrated and imaged with the Common Astronomy Software Applications package (CASA). We used version 4.2.0 (r28322) for setups S1 to S4 and version 4.2.1 (r29047) for setup S5. We used the standard procedures provided by the Joint ALMA Observatory to apply the bandpass, amplitude, and phase calibrations. The deconvolution was performed with the csclean imager mode and a Briggs weighting scheme with a robust parameter of 0.5. The cell size was set to 0.3′′. In addition, three or four iterations of self-calibration were performed using a strong spectral line detected toward Sgr B2(N1) in each setup. This significantly improved the dynamical range in the resulting images.
The spectra toward Sgr B2(N1) and (N2) are full of lines and close to the confusion limit. It is thus difficult to separate the line emission from the continuum emission in a systematic way for the full data cubes, but it is a necessary step to produce separate line and continuum maps. For each spectral window of each setup, we selected six groups of a few channels that seemed to be free of strong line emission. A first-order baseline was fitted to these selected channels and the result of the fit was used to split each data cube into two cubes: one for the line emission and one for the continuum emission. Given the difference in systemic velocity between the two hot cores (~10 km s-1, see Belloche et al. 2013), we selected different sets of channels for the northern and southern parts of the field. This process of baseline subtraction was performed with the CLASS software3.
We checked the accuracy of the relative astrometry between the ten measurement sets by fitting the peak position of the continuum emission toward Sgr B2(N1) in selected channels of the line+continuum data cubes that appeared to be free of line emission. It turns out that the first three measurement sets of setup S2 and both measurement sets of setup S3 are affected by an astrometric problem: the continuum peak of Sgr B2(N1) is shifted by 0.6′′ to 1.2′′ in right ascension with respect to all other measurement sets (see Table 1). The dispersion of the peak position in declination is also a bit higher for the affected measurement sets compared to the nonaffected measurement sets. The average peak position of Sgr B2(N1) in all nonaffected measurement sets is at (Δα, Δδ) = (0.15′′, −2.40′′), i.e. (α,δ)J2000 = (17h47m19.881s, −28°22′18.40′′). The five affected measurement sets were obtained after transit when the source was setting and the phase calibrator was at low elevation, which leads us to believe that the shift of the affected measurement sets may be due to an inacurrate calibration of the atmospheric phase fluctuations. As a result, we ignored the affected measurement sets of setup S2 and used only its fourth measurement set. For setup S3, both measurement sets were used but the offset was approximately compensated for by modifying the visibilities of the phase calibrator with the CASA task fixvis before the phase calibration. After this correction, the relative positional accuracy of all measurement sets selected for this work is on the order of ±0.1′′ in both right ascension and declination.
Beam sizes and noise levels.
The measurement sets of setup S3 were merged into one single measurement set with the CASA task concat before imaging. The same was carried out for setup S4. Only one measurement set was used for the other three setups. The size (HPBW) of the synthesized beam and the rms noise level in the final cubes are given in Table 2. The noise level of each spectral window corresponds to the median of the noise levels measured in all channel maps using the procedure go noise in GREG3. The noise levels reported in Table 2 were measured in the continuum-subtracted datacubes. They are typically a factor ~2 higher in the line+continuum datacubes.
Based on the redundancies of the measurement sets and the spectral overlap between the setups, we estimate the relative calibration uncertainty on the flux density to be on the order of 15%.
3. Radiative transfer modeling of the line survey
We used the input parameters of our LTE model of the IRAM 30 m spectrum of Sgr B2(N) (Belloche et al. 2013) as a starting point to assign the lines detected in the ALMA spectra and model the emission of the detected molecules. Given the high H2 densities of Sgr B2(N1) and (N2) (~108 cm-3 at arcsecond scale, Belloche et al. 2008, 2014; Qin et al. 2011), the LTE approximation is appropriate. We used the software Weeds (Maret et al. 2011) to produce synthetic LTE spectra that take into account the radiative transfer and the (spectral-window- and measurement-set-dependent) angular resolution of the observations. We performed the modeling for each species separately, and then we linearly added the contributions of all detected species to the emitted spectra to obtain the final synthetic spectrum (hereafter called the full LTE model). This approximation is valid for optically thin lines that overlap in frequency space or for (optically thick or thin) lines of species that are emitted from separated regions within the beam, but it is no longer correct for frequency-overlapping optically thick lines of species that are cospatial or aligned along the line of sight. In such cases, the synthetic spectrum overestimates the actual line flux density.
The model of each species is defined by five parameters: angular size of the emitting region assumed to be Gaussian, column density, rotational temperature, velocity offset with respect to the assumed systemic velocity of the source, and linewidth (FWHM). For a given species, the source size was derived from two-dimensional Gaussian fits to the integrated intensity maps of all transitions that were well detected and found to be free of contamination (based on the full LTE model). The source size was set to the median deconvolved size of all such transitions. The other four parameters were optimized by eye. We constructed population diagrams based on the transitions that are well detected and not severely contaminated by transitions of other species. In the case where a transition was partially contaminated, the contributions of the contaminating species was removed from the measured integrated intensities, on the basis of the full LTE model. Each population diagram was also corrected for optical depth following the method described in Goldsmith & Langer (1999), using the opacities delivered by Weeds. We used the population diagrams to verify that the rotational temperature derived in the course of the (manual) modeling with Weeds made sense.
In the population diagrams corrected for optical depth and contamination, the residual dispersion of the synthetic datapoints (red crosses) results in part from the frequency boundaries set to integrate the intensity. These boundaries are a compromise between covering the line as much as possible and limiting the contamination from other species emitting at nearby frequencies as much as possible. In addition, the correction for optical depth is an approximation and may also introduce some bias. Finally, another limitation of this fit is that it can be biased by residual contamination that remains even after removal of the contribution of the identified contaminating species. Therefore, we believe that the formal errors on the rotational temperature derived from the fit to the population diagrams do not necessarily represent the true errors on this temperature and should be viewed with caution.
The emission of vibrationally excited states of a given molecule were modeled independentely of the vibrational ground state. The emission of isotopologues of a given molecule were also modeled separately.
The physical structure of the source assumed for the modeling is uniform. This may sound simplistic given that temperature and density gradients are expected in the envelope of Sgr B2(N2) (e.g., Rolffs et al. 2011). It turns out that, even with such a simple assumption, the spectra of most complex organic molecules detected toward Sgr B2(N2) can be well reproduced so we are confident that the rotational temperatures and column densities derived from our analysis are reliable.
In the following, we count a line of a given species as a detected line if its frequency, peak intensity, and width are well reproduced by our model and the line is not (or barely) contaminated by emission from other species. As a counter example, a synthetic line that is consistent with the observed spectrum, i.e., that has a peak intensity simply below the intensity of the detected signal, but would still remain consistent if it were shifted by a frequency offset typically equal to its linewidth is not counted as detected. We emphasize that our definition of a detected line is very conservative but we believe that it is required to avoid unsecure molecule detections.
The complete list of transitions identified in our survey is presently not available but the list of lines identified in our previous single-dish survey of Sgr B2(N) can be taken as reference (Belloche et al. 2013).
4. Spectroscopic predictions
The origin of the spectroscopic predictions used to model the emission of the species reported in Sect. 5 is provided here.
Predictions for the three singly deuterated species of ethyl cyanide were taken from the catalog of the Cologne Database for Molecular Spectroscopy (CDMS4, Müller et al. 2001, 2005; tags 56 509, 56 510, and 56 511, all version 1). They are based on Margulès et al. (2009). All other ethyl cyanide data were also taken from the CDMS. The main species predictions are based on Brauer et al. (2009) with published data in the range of our survey from Fukuyama et al. (1996). Transition frequencies of the isotopologues containing one 13C were taken from Richard et al. (2012), those for the 15N isotopologue from Margulès et al. (2009). Vibrational corrections to the rotational partition function, and thus to the column density, were derived for the main isotopologue from Heise et al. (1981) and applied to all species. Only limited isotopic data are available. It is safe to assume that differences among the isotopologues are small, most likely not exceeding a few percent because of the large number of heavy atoms in the molecule.
Predictions for singly deuterated methyl cyanide were taken from the CDMS catalog (tag 42 511, version 2). This entry is based on Nguyen et al. (2013). Predictions for CH3CN in its ν8 = 1 and 2 excited states are based on preliminary results from Müller et al. (2015), those in ν4 = 1 are preliminary data from a subsequent study (Müller et al., in prep.). Transition frequencies in the range of our study are from Bauer & Maes (1969) and Bauer (1971) for ν8 = 1 and 2, respectively. Predictions for isotopic species with 15N or one or two 13C in their ground vibrational states are from the CDMS. They are based on Müller et al. (2009) with transition frequencies in the range of our survey from Demaison et al. (1979). Predictions for 13C isotopologues in their ν8 = 1 states are based on preliminary data from Müller et al. (2016a). Vibrational corrections to the partition function were included in the private entries for the main isotopic species. They are now available in Müller et al. (2015). As the corrections are small, the error using the values from the main isotopic species for the other isotopologues as well is very small, even for CH2DCN.
Predictions for deuterated vinyl cyanide CH2CDCN were taken from the molecular spectroscopic database of the Jet Propulsion Laboratory (JPL5, Pickett et al. 1998; tag 54 004, version 2). We prepared predictions for cis-CHDCHCN and trans-CHDCHCN. All predictions are based on Colmont et al. (1997). Predictions for C2H3CN and isotopic species with one 13C or with 15N were taken from the CDMS and are based on Müller et al. (2008). Transition frequencies in the range of our survey are mostly from that study. For the main species, they are, to a large extent, also from Baskakov et al. (1996). Predictions for excited states of vinyl cyanide used in the present work are based on Cazzoli & Kisiel (1988) and unpublished data from one of us (HSPM). These data included vibrational corrections which are essentially complete at 200 K. The vibrational energies were gathered from several sources. A recent compilation of low-lying vibrational states is available in Kisiel et al. (2015). It is safe to assume that differences among the isotopologues are small, most likely not exceeding a few percent because of the large number of heavy atoms in the molecule.
Predictions for deuterated cyanoacetylene were taken from the CDMS catalog (tag 52 508,
version 2). This entry is based on Spahn et al.
(2008). All other cyanoacetylene predictions were also taken from the CDMS. The
ν7 = 1 predictions
of the main species are based on Thorwirth et al.
(2000) with data in the range of our survey from Yamada & Creswell (1986). All predictions of isotopologues containing one or
two 13C are based on
Thorwirth et al. (2001), and those for
HC N on Fayt et
al. (2004). Ground state transition frequencies for singly substituted species in
the range of our survey were taken from Creswell et al.
(1977). Vibrational contributions to the partition functions of HC3N and DC3N can be evaluated from the study
of their low-lying vibrational states by Uyemura et al.
(1982). Isotopic shifts, in particular of the lowest ν7 mode, are much
smaller for 13C or
15N species.
Therefore, using vibrational corrections of the main isotoplogue introduces small errors for
these species.
N on Fayt et
al. (2004). Ground state transition frequencies for singly substituted species in
the range of our survey were taken from Creswell et al.
(1977). Vibrational contributions to the partition functions of HC3N and DC3N can be evaluated from the study
of their low-lying vibrational states by Uyemura et al.
(1982). Isotopic shifts, in particular of the lowest ν7 mode, are much
smaller for 13C or
15N species.
Therefore, using vibrational corrections of the main isotoplogue introduces small errors for
these species.
Predictions for deuterated methanol CH2DOH were taken from the JPL catalog (tag 33 004, version 1). They are based on Pearson et al. (2012) with rest frequencies almost entirely from that study. With the use of torsional energies from Lauvergnat et al. (2009), we estimate a vibrational correction factor to the partition function of 1.15 at 160 K. For CH3OD, we prepared a catalog entry based on Anderson et al. (1988), with frequencies updated to the values published in Duan et al. (2003). We estimated the partition function to be 11 770 at 150 K and 25 550 at 225 K, taking torsional energies of CH3OD in Anderson et al. (1988) into account. Details on other methanol isotopologues are given in Müller et al. (2016b).
Predictions for all singly deuterated species of ethanol were taken from the CDMS (tags 47 515 to 47 518, all version 1). They are based on Walters et al. (2015) with rest frequencies almost entirely from that study. All other ethanol analyses were taken from Müller et al. (2016b), and further details can be found there. Conformational and vibrational corrections to the partition function were taken from the main isotopologue for which only data were available. This assumption is reasonable, though errors may not be completely negligible. They are, however, difficult to evaluate.
Predictions for both conformers of CH2DOCHO were extracted from Table 7 of Coudert et al. (2013) and split into two separate entries. The partition function was taken from their Table 6. It is identical for both entries. Contrary to the CDMS entries for CH2DCH2CN and CH2DCH2OH, this treatment means that the two entries represent a single species with a statistical distribution (the out-of-plane conformer being twice as abundant as the in-plane one). This means that the column density derived for each conformer represents the total column density of the molecule. However, we assumed a statistical distribution (2:1) to compute and report individual column densities in Sect. 5. Predictions for the main isotopologue were taken from the JPL catalog. The entry is based on Ilyushin et al. (2009). Vibrational corrections to the partition function were derived from the 13C species (Favre et al. 2014). These authors provide rotational partition function values at different temperatures as well as detailed vibrational corrections that are complete up to 300 K. The correction factors are 1.59 and 1.23 at 150 K for the deuterated and main isotopic species, respectively. These values differ because values for the deuterated species refer to the ground state only whereas contributions of the first excited states were already included for the main isotopologue.
5. Results
In this section, we report the detection or tentative detection of deuterated complex organic molecules toward Sgr B2(N2). Column density upper limits are also reported for several nondetections. Each subsection first presents the LTE model derived for the main isotopologue and its 13C and/or 15N isotopologues. This model is then used to obtain constraints on the column density of the deuterated species. The rotational temperatures derived from fits to the population diagrams are reported in Table 3 and the parameters of the LTE model used to fit the spectra are listed in Table 4. The analysis toward Sgr B2(N2) was performed at the offset position (Δα, Δδ) = (−0.1″,2.6″), i.e. (α,δ)J2000 = (17h47m19.86s, −28°22′13.4′′).
5.1. Deuterated ethyl cyanide CH2DCH2CN and CH3CHDCN
Rotational temperatures derived from population diagrams of selected (complex) organic molecules toward Sgr B2(N2).
About 154, 54, 38, and 37 lines of ethyl cyanide and its singly substituted 13C isotopologues, 13CH3CH2CN, CH313CH2CN, and CH3CH213CN, respectively, are detected toward Sgr B2(N2) (Figs. A.1–A.4). The 15N isotopologue is also detected unambiguously, with nine detected lines (Fig. A.5). The best-fit LTE model fits very well all detected transitions, except the very optically thick lines of the main isotopologue, which it significantly underestimates. We ignored the lines with optical depth higher than ~2.5 to construct the population diagram of this species (Fig. A.6), while all lines of the 13C isotopologues that matched the criteria defined in Sect. 3 were used for their population diagrams (Figs. A.7–A.9). The results of the linear fit to the population diagrams of all four isotopologues are given in Table 3. The rotational temperature is well constrained to ~140 K for both C2H5CN and 13CH3CH2CN. This value is consistent with the result of the fit for the two other isotopologues within the uncertainties. The temperature derived in this way depends on the model used to make the opacity correction. With an earlier best-fit model that assumed a temperature of 170 K (instead of 150 K here), the fit to the population diagrams of both C2H5CN and 13CH3CH2CN yielded a temperature of ~150 K. This is the reason why we decided to assume a rotational temperature of 150 K for ethyl cyanide and all its isotopologues.
Parameters of our best-fit LTE model (or upper limit) of selected (complex) organic molecules toward Sgr B2(N2).
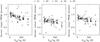 |
Fig. 1 Deconvolved major, minor, and mean sizes (FWHM) derived for uncontaminated C2H5CN transitions detected toward Sgr B2(N2) and plotted as a function of upper level energy. The symbols code for the spectral setup (S1 to S5, like in Table 2). In each panel, the dashed line indicates the median value. |
The median source size derived for the selected lines of C2H5CN is about 1.15″, but there seems to be a trend of decreasing size with increasing upper level energy, from ~1.3″ at low energy to ~0.8″ at Eu ~ 700 K (Fig. 1). Similar results are obtained for 13CH3CH2CN, with a median size of ~1.25″ and a hint of a decrease down to ~1.0″ at Eu ~ 120 K. Our model does not treat such gradients. As a compromise, we used a source size of 1.2″.
With this source size and a rotational temperature of 150 K, we obtain an excellent fit to all emission lines of the four isotopologues, except for the very optically thick lines of C2H5CN (τmax ~ 60), as mentioned above. A better fit to these lines would be obtained by increasing the temperature and/or assuming a larger source size. Increasing the size to 1.4″ turns out to be insufficient. A larger size would be inconsistent with the measured sizes. Increasing the temperature to 200 K and the size to 1.3″ yields peak temperatures of the optically thick lines similar to those observed, but the synthetic lines look too saturated compared to the observed lines, and the fit to the optically thin lines becomes worse; lines with high upper level energies become overpredicted. A more complex model with nonuniform physical parameters would probably be needed to reproduce the intensity and shape of the very optically thick lines.
Assuming the same source size, rotational temperature, linewidth, and velocity offset as derived for C2H5CN and its 13C and 15N isotopologues, we looked for emission of the singly deuterated isotopologues, CH3CHDCN and CH2DCH2CN. The former is a chiral molecule because the carbon atom in the middle of the chain is linked to four different atoms or functional groups. Both isotopologues are tentatively detected toward Sgr B2(N2) with 1 and 2 line(s), respectively (Figs. A.10 and A.11), the latter isotopologue in its out-of-plane conformation only. For the in-plane confomer of CH2DCH2CN, we derive an upper limit only. This upper limit is uncertain because the apparent inconsistency between the synthetic spectrum and the observed one around ~101 190 MHz may result from a slight overestimate of the baseline, at the 3σ level (Fig. A.12). Owing to the limited signal-to-noise ratios, the source size derived from the integrated intensity maps of the uncontaminated lines assigned to CH3CHDCN and CH2DCH2CN is uncertain, varying between unresolved and ~2′′. The emission looks compact in the maps. Thus, assuming the same source size as the other isotopologues looks reasonable.
5.2. Deuterated methyl cyanide CH2DCN
Methyl cyanide is clearly detected in its vibrational ground state toward Sgr B2(N2) but its transitions are very optically thick (τmax ~ 50) and cannot be properly fitted in the framework of our simple model (Fig. A.13). Transitions from within its vibrationally excited states ν8 = 1 and ν8 = 2 are also clearly detected, with τmax ~ 2.7 and 0.3, respectively (Figs. A.14 and A.15). We also find four transitions from within ν4 = 1 around 91 520 MHz and 109 820 MHz (τmax ~ 0.06), but they partially suffer from blends with other species (Fig. A.16). The assignment looks reasonable, but the detection should be considered tentative.
The singly substituted 13C isotopologues are very well detected, both in their vibrational ground state and in their first vibrationally excited state ν8 = 1 (Figs. A.17–A.20). The fit to their population diagrams yields rotational temperatures of about 170 K (see Table 3 and Figs. A.21 and A.22). The analysis of the integrated intensity maps of the 13C isotopologues delivers a source size of ~1.4″. For the main isotopologue, it seems that the source size decreases with the vibrational energy (~1.2″ for ν8 = 1 and ~0.8″ for ν8 = 2).
With the assumption of a source size of 1.4″ and a temperature of 170 K, our LTE modeling yields excellent and consistent fits to the 13C isotopologues (both ν= 0 and ν8 = 1) and to the ν8 = 1 transitions of the main isotopologue. However, it was necessary to increase the column density and linewidth to fit the transitions of the ν8 = 2 and ν4 = 1 states. The fit to the population diagram of the main isotopologue including the three vibrationally excited states suggests a temperature of ~250 K (Fig. A.23). This explains why our 170 K model needs higher column densities to reproduce the intensities of the ν8 = 2 and ν4 = 1 transitions. Here again, a more complex model with a nonuniform physical structure would be necessary to fit all transitions in a consistent way. However, given that our simple LTE model yields a good fit to the ν8 = 1 transitions of the main isotopologue and all transitions of the 13C isotopologues with a single set of parameters, we consider that the derived 12C/13C column density ratios are reliable.
On the basis of the LTE model obtained above, we were able to identify emission from the doubly substituted 13C isotopologue of methyl cyanide, 13CH313CN. One transition at 107 108 MHz is well detected, and a group of transitions at 89 270 MHz is relatively well detected (Fig. A.24). Given that the column density ratio of the singly to doubly substituted isotopologues is very close to the ratio between the main isotopologue and those that are singly substituted, we consider the identification of 13CH313CN as secure.
Our LTE modeling indicates that the 15N isotopologue contributes significantly to the emission detected at 107 054 MHz and 107 060 MHz (Fig. A.25). Since there is no clearly detected line, we do not consider this identification as secure. The derived column density is, therefore, relatively uncertain and should rather be considered as an upper limit.
Finally, using the same parameters as for the other isotopologues, we obtain a secure identification of singly deuterated methyl cyanide, CH2DCN, with about six transitions clearly detected (Fig. A.26). The rotation temperature derived from the population diagram is consistent with the assumed temperature within 2.4σ (Table 3 and Fig. A.27). The source size can be measured for three of the detected transitions and is found to be consistent with the size derived from the 13C isotopologues.
5.3. Deuterated cyanoacetylene DC3N
Cyanoacetylene is detected toward Sgr B2(N2) in its vibrational ground state (Fig. A.28) as well as in many vibrationally excited states: ν7 = 1 (Fig. A.29), ν7 = 2 (Fig. A.30), ν6 = 1 (Fig. A.31), ν5 = 1 and ν7 = 3 (Fig. A.32), and ν6 = ν7 = 1 (Fig. A.33). In addition, emission from within the following excited states is tentatively detected: ν4 = 1 (one detected line, Fig. A.34), ν7 = 4 and ν5 = ν7 = 1 (significantly contributes to detected signal, but no line individually detected, Fig. A.35)6, and ν6 = 2 (one detected line, Fig. A.36).
The three singly substituted 13C isotopologues of cyanoacetylene are also clearly detected in their vibrational ground state (Figs. A.37–A.39) and in ν7 = 1 (Figs. A.40–A.42). HC13CCN is also detected in ν7 = 2 (Fig. A.43) while the two other isotopologues are only tentatively detected in this state (Figs. A.44 and A.45). HC13CCN and HCC13CN are tentatively detected in ν6 = 1 with one detected line each (Figs. A.46 and A.47). Emission of H13CCCN in ν6 = 1 significantly contributes to the detected signal, but this state cannot be unambiguously identified (Fig. A.48).
Two doubly substituted 13C isotopologues of cyanoacetylene, H13C13CCN and HC13C13CN are tentatively detected in their vibrational ground state with one line each (Figs. A.49 and A.50). The third, H13CC13CN has no clearly detected line, but the model using the same parameters as the former two isotopologues is fully consistent with the signal detected around 105 328 MHz (Fig. A.51). Therefore we consider this species as tentatively detected too.
The 15N isotopologue HC315N is not unambiguously detected in its vibrational ground state, but if we assume a 14N/15N isotopic ratio of 300, it contributes significantly to the detected signal at 88 334 MHz and 105 999 MHz and is therefore included in our model (Fig. A.52). The column density of this isotopologue should rather be considered as an upper limit.
The fits to the integrated intensity maps suggest that the size of the emission decreases with increasing energy of the vibrational state from within which the lines are emitted. Since our model cannot account for a nonuniform physical structure, we defined two groups of vibrational states: ν= 0 and ν7 = 1 were modeled with a source size of 1.3″ while the higher excited states were modeled assuming 0.9″.
The fits to the population diagrams of the singly substituted 13C isotopologues including both ν= 0 and ν7 = 1 yield rotational temperatures of ~170–180 K (Table 3, Figs. A.53–A.55). With a temperature of 170 K and a source size of 1.3″, the emission of all isotopologues reported above is well fitted up to ν7 = 1, except for the vibrational ground state of HC3N: its transitions are very optically thick (τmax ~ 30) and cannot be reproduced with our simple model. For the vibrationally excited states of the main and singly substituted 13C isotopologues above ν7 = 1, we assume a source size of 0.9″ and obtain a very good fit to the observed spectra with a temperature of 200 K and a unique column density (divided by 20 for the 13C isotopologues) that is 1.5 times higher than for the model of the lower states.
Assuming the same parameters as derived above for the vibrational ground state, we looked for emission of deuterated cyanoacetylene DC3N. The molecule seems to contribute at a level of ~70% to the signal detected at 101 315 MHz (Fig. A.56). The rest of the emission comes from a transition of CH2CO in its vibrationally excited state ν9 = 1. The detection of DC3N is only tentative, and its column density should rather be considered as an upper limit.
5.4. Deuterated methanol CH2DOH
Methanol and its 13C and 18O isotopologues are well detected toward Sgr B2(N2). The detected lines and detailed modeling of these species is presented in a companion paper (Müller et al. 2016b). We report in Table 4 the parameters derived in that paper for the main isotopologue based on the analysis of all isotopologues.
Assuming the same source size and rotational temperature, we obtain a tentative detection of CH2DOH, with two lines detected at 91 587 MHz (41,3e0–40,4e0) and 99 672 MHz (61,5e0–60,6e0), two lines tentatively detected at 85 600 MHz (62,4e1–61,6o1) and 94 563 MHz (11,0o1–10,1o1), and a few other lines contributing significantly to the detected signal (Fig. A.57). The line appearing at 91 589 MHz in the full synthetic model with no counterpart in the observed spectrum corresponds to two transitions of acetone (2318,6–2317,7 of the EE state and 2318,6–2317,7 of the AE state). While acetone is unambiguously detected in our ALMA spectrum of Sgr B2(N2), a significant number of predicted lines of acetone do not match the observed spectrum. The spectroscopic predictions are not accurate enough for this set of problematic lines, the line at 91 589 MHz being one of those. The ALMA spectrum suggests that the true frequency could be 91 592 MHz for this acetone line. The source size derived from the maps of the two detected CH2DOH lines is uncertain but the emission looks compact in the integrated intensity maps and is consistent with the source size assumed for the modeling.
5.5. Upper limits
5.5.1. Deuterated methanol CH3OD
CH3OD is not unambiguously detected toward Sgr B2(N2). It may significantly contribute to the emission detected at 90 743 MHz (blend of 101,1–92,1 and 21,0–11,0), 110 951 MHz (41,0–40,0), 111 846 MHz (51,0–50,0), and 113 352 MHz (61,0–60,0), but there is no clearly detected line (Fig. A.58). Assuming the same parameters as for methanol (Sect. 5.4), we derive a column density upper limit that is a factor 1.8 times lower than the column density tentatively derived for CH2DOH (Table 4). This upper limit corresponds to the synthetic spectrum shown in red in Fig. A.58.
5.5.2. Deuterated vinyl cyanide CHDCHCN and CH2CDCN
Many lines of vinyl cyanide are detected in its ground state and vibrationally excited states ν11 = 1, ν15 = 1, and ν11 = 2 (Figs. A.59–A.62). The sizes derived from the corresponding integrated intensity maps tend to decrease with increasing energy, from ~1.2″ for Eup< 100 K to ~0.8″ for higher energy transitions. As a compromise we adopt a source size of 1.1″. With this source size, the analysis of the population diagram yields a temperature of ~200 K (Table 3 and Fig. A.63). Transitions from within even higher vibrationally excited states are also detected toward Sgr B2(N2), but we do not report about these states.
Transitions of all three singly substituted 13C isotopologues of vinyl cyanide are also clearly detected (Figs. A.64–A.66; see also Müller et al. 2008 for a previous single-dish detection). Only a few lines are sufficiently free of contamination to allow for a size measurement in the corresponding integrated intensity maps. The outcome is more uncertain than for the main isotopologue, but is consistent with the source size adopted above. Because of the smaller number of detected lines, the population diagrams have a higher dispersion than for the main isotopologue and the rotational temperature is less well constrained but the fits to all three diagrams are consistent with a temperature of about 200 K (Figs. A.67–A.69).
As a result of this analysis, we adopt a source size of 1.1″ and a temperature of 200 K for vinyl cyanide and its isotopologues. With these parameters, we do not detect the 15N isotopologue. We also looked for the singly deuterated species cis-CHDCHCN, trans-CHDCHCN, and CH2CDCN, but did not detect them. Column density upper limits are reported in Table 4.
5.5.3. Deuterated ethanol CH3CH2OD, CH3CHDOH, and CH2DCH2OH
Ethanol and its 13C isotopologues are well detected toward Sgr B2(N2). The detected lines and detailed modeling of these species is presented in a companion paper (Müller et al. 2016b). We report in Table 4 the parameters derived in that paper for the main isotopologue based on the analysis of all isotopologues.
Assuming the same LTE parameters as for the main isotopologue, we searched for all singly deuterated isotopologues of ethanol. None is detected. Upper limits to their column densities are reported in Table 4.
5.5.4. Deuterated methyl formate CH2DOCHO
Methyl formate is clearly seen toward Sgr B2(N2), with dozens of transitions detected in both its ground and first torsional states (Figs. A.70 and A.71). We derive a median source size of 1.5′′ from fits to the integrated intensity maps of its numerous uncontaminated lines. The formal fit to its population diagram including both states yields a rotational temperature of ~140 K (Fig. A.72 and Table 3). We used a temperature of 150 K in our model, which fits the ALMA spectrum very well, apart from a few discrepancies that we describe now. The reason why the synthetic spectrum of the ground state poorly fits the ALMA spectrum at 100 080 MHz is unclear. It may be due to the nearby HC3N 11–10 transition at 100 076 MHz, which is probably affected by self-absorption and/or spatial filtering and is by far overestimated by our simple LTE model. The discrepancy around 110 226 MHz is due to contamination by diffuse cloud absorption in 13CO 1–0 that is not yet included in our full model. Similar contamination by c-C3H2 absorption features not yet implemented in our full model likely explains the small discrepancies for the νt = 1 transitions around 85 370 MHz.
Assuming the same LTE parameters as for the main isotopologue, we searched for the in-plane and out-of-plane conformers of CH2DOCHO toward Sgr B2(N2) but none of them is detected. Upper limits to their individual column densities are reported in Table 4.
6. Discussion
6.1. Comparison to other observations
The levels of deuterium fractionation derived in Sect. 5 for (complex) organic molecules toward Sgr B2(N2) are summarized in Table 5 and shown in Fig. 2.
Deuterium fractionation of selected (complex) organic molecules toward Sgr B2(N2) compared to predictions of astrochemical models.
6.1.1. Deuterated methyl cyanide
The detection of CH2DCN toward Sgr B2(N2) is the most secure among the deuterated species reported here (Sect. 5.2 and Fig. A.26). On the basis of the LTE modeling of methyl cyanide and its various isotopologues, we derive a deuterium fractionation of 0.4% for this molecule. This is a factor 2.6 lower than the fractionation reported by Gerin et al. (1992) toward Orion KL (1%). Along with this first interstellar detection, these authors also reported a tentative detection toward the hot core G34.26+0.15 that, if true, would indicate a similar level of deuterium fractionation as toward Orion KL. The difference with the level measured in Sgr B2(N2) is probably not significant because the Orion KL and G34.26+0.15 values may suffer, as mentioned by these authors, from a lack of knowledge of the source size and opacity of the lines of the main isotopologue.
A detection of deuterated methyl cyanide toward the Class 0 (low-mass) protostar IRAS 16293–2422 was also reported in Taquet et al. (2014) based on an unpublished analysis. They quote a deuterium fractionation of 1.3%, a factor 3.4 higher than the one obtained for Sgr B2(N2).
6.1.2. Deuterated ethyl cyanide
Both deuterated isotopologues of ethyl cyanide are tentatively detected toward Sgr B2(N2) (Sect. 5.1 and Figs. A.10 and A.11). We derive a deuterium fractionation of ~0.05% for both CH2DCH2CN (in its out-of-plane conformation) and the chiral molecule CH3CHDCN. The upper limit obtained for the in-plane conformer of CH2DCH2CN (Fig. A.12) is still consistent with the expectation that it should be half as abundant as the out-of-plane conformer. If we assume this expected ratio, then the total deuterium fractionation for CH2DCH2CN would be ~0.075%, a factor 1.5 times higher than for CH3CHDCN. This would be consistent with the statistical expectation because the methyl group at the end of the carbon chain has three equivalent hydrogen atoms while the middle chain group has only two.
The deuterium fractionation derived for ethyl cyanide toward Sgr B2(N2) is nearly one order of magnitude lower than for methyl cyanide (0.4%), but similar within a factor two to methanol (0.12%) and cyanoacetylene (0.09%).
Margulès et al. (2009) reported a detection of the 15N isotopologue of ethyl cyanide toward Orion KL but obtained only an upper limit for CH2DCH2CN. They derived a column density ratio [CH2DCH2CN (oop)]/[C2H5C15N] < 0.33, which translates into [CH2DCH2CN (oop)]/[C2H5CN] < 0.2% using the 14N/15N isotopic ratio of 148 ± 74 derived by Daly et al. (2013). Daly et al. (2013) claimed tentative detections of both deuterated isotopologues of ethyl cyanide with a deuterium fractionation of 2% based on the same survey of Orion KL. No detected transitions are shown in that study, though, and their Table 3 actually reports upper limits for the deuterated species. Given the lower deuterium fractionation obtained by Gerin et al. (1992) for methyl cyanide toward Orion KL (1%) and the order of magnitude difference in deuterium fractionation between methyl cyanide and ethyl cyanide obtained here toward Sgr B2(N2), a deuterium fractionation of 2% for ethyl cyanide in Orion KL sounds unlikely and questions the tentative detection of Daly et al. (2013).
6.1.3. Deuterated methanol
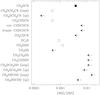 |
Fig. 2 Deuterium fractionation of (complex) organic molecules toward Sgr B2(N2). Secure detections are indicated with a filled square, tentative detections with an empty square, and upper limits with an arrow pointing to the left. The notations oop and ip describe the position of the deuterium and stand for out of plane and in plane, respectively. |
CH2DOH is tentatively detected toward Sgr B2(N2) (Sect. 5.4 and Fig. A.57). The deuterium fractionation we derive for this isotopologue is 0.12%, a factor ~3 lower than the value we obtain for methyl cyanide, the deuterated species of which is securely identified in our ALMA spectrum of Sgr B2(N2) (Sect. 6.1.1). Therefore, even if the difference in deuterium fractionation between methanol and methyl cyanide is a priori surprising, the fact that it is lower for methanol gives us more confidence in the detection of CH2DOH. The deuterium fractionation derived for CH2DOH is a factor five lower than toward the Compact Ridge in Orion KL (0.58%, Neill et al. 2013), about one order of magnitude lower than toward the high-mass protostellar objects surveyed by Fontani et al. (2015) and the intermediate-mass protostar NGC 7129 FIRS 2 (2%, Fuente et al. 2014), and more than two orders of magnitude lower than toward Class 0 protostars which have values between 19% and 33% (Parise et al. 2006)7.
Evidence for the presence of CH3OD is too tenuous in our ALMA spectrum of Sgr B2(N2) to claim a detection, even a tentative one (Sect. 5.5.1). Still, we cannot completely exclude that CH3OD is present at the level indicated by our upper limit. The synthetic spectrum shown in Fig. A.58 indicates that a large fraction (>50%) of the flux density detected at 90 744, 99 964, 110 951, and 113 352 MHz may well be emitted by this molecule. If this is true, the deuterium fractionation of methanol would then be ~0.07% for CH3OD. This would be nearly one order of magnitude lower than toward the Compact Ridge in Orion KL (0.5%, Neill et al. 2013) and about 50 times lower than toward Class 0 protostars (1.6%–4.7%, Parise et al. 2006).
A detection of CH3OD toward Sgr B2 was reported by Gottlieb et al. (1979) with the 36 foot radio telescope of the National Radio Astronomy Observatory at Kitt Peak (HPBW ~ 74′′). These authors detected a line at the frequency expected for the pair of partially blended transitions 2-1–1-1 E (90 703.6 MHz, Eu/kB = 11.3 K) and 20–10 A (90 705.8 MHz, Eu/kB = 6.5 K), but they did not detect the nearby 21–11 E transition (90 743.5 MHz, Eu/kB = 15.6 K), which is in fact expected to be partially blended with the 101–92 A transition (90 741.7 MHz, Eu/kB = 124 K). The former two transitions are blended with deep HNC absorption features produced by diffuse clouds along the line of sight in our ALMA spectrum of Sgr B2(N2). This prevents their detection in our spectrum (see Fig. A.58). Our LTE model shows that, for a temperature of 160 K, the latter two transitions are expected to be as strong as the former two. We conclude from this that either the assignment of the 90 704 MHz line to CH3OD in the Kitt Peak spectrum was not correct, or the line reported by Gottlieb et al. (1979) traces low-excitation emission of CH3OD. Given that the line detected in emission in the Kitt Peak spectrum dominates over the absorption features, opposite to what is seen in the ALMA spectrum, this emission line, if real, must come from a region more extended than the Sgr B2 continuum emission that is absorbed by the diffuse clouds along the line of sight. Such an extended emission would be filtered out in our ALMA spectrum.
Gottlieb et al. (1979) derived a ratio [CH3OD]/[13CH3OH] ~ 0.18 for Sgr B2. This translates into [CH3OD]/[CH3OH] ~ 0.7%, assuming a 12C/13C isotopic ratio of 25 as derived for methanol toward Sgr B2(N2) in the companion paper Müller et al. (2016b). This is an order of magnitude higher than our upper limit of 0.07% derived in Sect. 5.4. This discrepancy seriously questions the detection of CH3OD reported by Gottlieb et al. (1979) toward Sgr B2, unless deuteration of methanol is more efficient by one order of magnitude on large scales in the Sgr B2 cloud compared to the embedded hot cores. Comito et al. (2003) derived an abundance ratio [HDO]/[H2O] ~ 0.06% toward the Sgr B2 hot cores and their T< 100 K envelope, and even lower values of ~0.013% and ~0.02% (uncertain within a factor two) were obtained for [DCN]/[HCN] and [DCO+]/[HCO+] in the molecular ridge close to Sgr B2(M) (Jacq et al. 1999). Deuterium fractionation thus does not appear to be generally more efficient on larger scales in Sgr B2, which again questions the detection of CH3OD reported by Gottlieb et al. (1979).
6.1.4. Deuterated cyanoacetylene
The detection of DC3N reported toward Sgr B2(N2) is only tentative (Sect. 5.3 and Fig. A.56). We obtain a deuterium fractionation of 0.09%, similar to the values obtained for methanol and ethyl cyanide. DC3N was first detected toward TMC 1 with a deuterium fractionation of 2–8% (Langer et al. 1980), revised to a lower value of 1.5% by Turner (2001). High values were reported with single dish telescopes for a number of other cold dense cores (5%–10%, Howe et al. 1994) as well as for a protostar in a stage of “Warm Carbon-Chain Chemistry” (~3%, Sakai et al. 2009). A tentative detection toward the Compact Ridge and the Hot Core of Orion KL was recently reported with a deuterium fractionation of 1.5% ± 0.9% (Esplugues et al. 2013). A tentative detection was also recently reported toward the high-mass protostar NGC 2264 CMM3 (1.8% ± 1.5%, Watanabe et al. 2015). The deuterium fractionation of cyanoacetylene tentatively derived toward Sgr B2(N2) is thus at least one order of magnitude lower than in Orion and NGC 2264 CMM3 (if confirmed) and even two orders of magnitude lower than in cold dense gas.
6.1.5. Deuterated vinyl cyanide
The column density upper limits reported in Sect. 5.5.2 yield deuterium fractionations <0.8%, <0.8%, and <0.5% for cis-CHDCHCN, trans-CHDCHCN, and CH2CDCN, respectively. We are not aware of any reliable detection of deuterated vinyl cyanide in the interstellar medium.
6.1.6. Deuterated ethanol
The column density upper limits reported in Sect. 5.5.3 yield deuterium fractionations <1.5%, <1.5%, <1.5%, and <1.0% for CH3CH2OD, CH3CHDOH, and the out-of-plane and in-plane conformers of CH2DCH2OH, respectively. The latter two translate into a total deuterium fractionation <2.5% for CH2DCH2OH. These upper limits are about one order of magnitude higher than the deuterium fractionation measured for methanol (Sect. 6.1.3). They are thus not very constraining. We are not aware of any detection of deuterated ethanol in the interstellar medium.
6.1.7. Deuterated methyl formate
The column density upper limits reported in Sect. 5.5.4 yield deuterium fractionations <2.0% and <0.6% for the out-of-plane and in-plane conformers of CH2DOCHO, respectively. This implies an upper limit of 2.6% for the molecule as a whole, or even 1.8% if we assume a statistical distribution and use the most stringent constraint provided by the in-plane conformer. A detection of CH2DOCHO toward the Compact Ridge of Orion KL was reported by Coudert et al. (2013). They derived a deuterium fractionation of 4% ± 2%. Fuente et al. (2014) reported a tentative detection of CH3OCDO and both conformers of CH2DOCHO at a deuteration level of 6% toward the intermediate-mass protostar NGC 7129 FIRS 2, but the value is uncertain as a result of blends with other species. Our upper limit for Sgr B2(N2) lies a factor two to three below these values.
6.2. Comparison to predictions of chemical models
We compare the deuterium fractionation derived for complex organic molecules toward Sgr B2(N2) to predictions of astrochemical models that investigated the deuteration of such species. The case of deuterated methanol is more specifically discussed in Sect. 6.3 below. The two models considered here follow the evolution of molecular abundances in a collapsing dense core that is heated up by the central protostar once it is formed (Taquet et al. 2012, 2014; Aikawa et al. 2012). These models were designed for Class 0 protostars, i.e. low-mass objects, so they are not optimum for a comparison to Sgr B2(N2). However they are the only models dealing with deuterated complex molecules that are presently available in the literature. No model following the deuteration of complex molecules in a high mass star-forming region like Sgr B2(N2) has been published so far. As we see in Sect. 6.4, there is a clear need for that.
Both models couple the chemistry in the gas phase and on the dust grains. The layering of the icy grain mantles and the presence of ortho- and para-H2 are taken into account in Taquet et al. (2014, hereafter T14) but not in Aikawa et al. (2012, hereafter A12). Model A12 uses a one-dimensional radiation hydrodynamic model of gravitational collapse, preceded by a hydrostatic phase that lasts for one million years. Model T14 relies on a parametric description of the quasi-static formation of the dense core followed by a free-fall collapse phase during which the protostar quickly appears after one free-fall time. In both models, the gas and dust temperatures are kept equal. In model T14, the temperature decreases from 17 K at the external radius down to about 7 K in the inner parts of the core at the end of the prestellar phase. In model A12, the external temperature is about 10 K and drops to about 5 K at the end of the prestellar phase. In both models, the temperature increases once the protostar appears.
Table 5 lists the deuterium fractionations predicted by both astrochemical models in the hot corino central region at the beginning and end of the Class 0 phase. Nearly all predicted values are at least a factor four higher than those obtained toward Sgr B2(N2). The only exception is the deuterium fractionation of CH3CN: it is predicted to decline during the Class 0 phase in model T14 and the measured value lies close to (a factor 2.5 above) the lower end of the predicted range. The decrease of the deuterium fractionation of complex organic molecules during the hot corino phase in model T14 is due to the collapse of the envelope: as time goes by, the gas passing through the hot corino is originating from shells that were initially at larger radii, i.e. lower densities, and underwent lower deuteration, imposed by a lower level of CO depletion and a higher [ortho-H2]/[para-H2] ratio. However, model A12 predicts an increase of the deuterium fractionation of CH3CN with time during the protostellar phase, with values a factor >5 higher than measured toward Sgr B2(N2), i.e. in worse agreement with the observations than model T14. The fact that model A12 does not predict a decrease of the deuteration of complex organic molecules with time may be due to the model not taking the multilayered structure of ice mantles into account.
The deuterium fractionation predicted by model T14 for methanol is 1.5–3.4 times higher than that of methyl cyanide while model A12 finds the opposite, with methyl cyanide becoming 2.6 times more deuterated than methanol at the end of the Class 0 phase. The ratio measured toward Sgr B2(N2) is more in agreement with model A12.
Model T14 predicts higher deuterium fractionations for methyl formate and dimethyl ether because these more complex molecules are formed from the photodissociation of highly deuterated formaldehyde and methanol at the surface of dust grains when they start to warm up. Both molecules are predicted to be even more deuterated than methanol. The upper limit we derive for the deuteration of methyl formate – an order of magnitude higher than that of methanol – is not stringent enough to test this prediction. The model predictions for these more complex molecules could lead us to expect a similar behavior for ethyl cyanide compared to methyl cyanide. The tentative deuteration level we measured for ethyl cyanide is, however, not consistent with this naive expectation: ethyl cyanide is (at least) about a factor five less deuterated than methyl cyanide in Sgr B2(N2).
Unlike all other complex organic molecules, the formation of methyl cyanide is dominated
by gas-phase processes in our own models (e.g., Garrod et
al. 2008; Garrod 2013). This occurs via
the reaction CH + HCN → CH3CNH+, followed by dissociative
recombination. In these models, the CH ion is formed via
H + CH3OH → CH + H2O + H2 and similar reactions of
methanol with He+
and C+. If
equivalent gas-phase reactions also dominate the formation of deuterated methyl cyanide,
then the apparent discrepancy between the degrees of deuteration of methyl cyanide and
ethyl cyanide may come from their different formation pathways, methyl cyanide in the gas
phase but ethyl cyanide on the surface of dust grains. Numerical simulations should be
performed to test this hypothesis.
The rotational temperature and source size derived for vinyl cyanide toward Sgr B2(N2) seem to indicate an origin in a somewhat warmer and more compact region than for ethyl cyanide. This is a priori consistent with the early model of Caselli et al. (1993) where the gas-phase abundance of vinyl cyanide is predicted to increase with time in the hot core where it is formed via protonation of ethyl cyanide followed by dissociative recombination. However, this channel has not been measured in the laboratory nor properly calculated. It is thus not clear whether this path dominates the formation of vinyl cyanide. If it does, we might expect a similar deuterium fractionation as for ethyl cyanide, but this is a simplistic assumption. The upper limit we derive for the deuteration of vinyl cyanide toward Sgr B2(N2), more than one order of magnitude higher than the deuteration measured for ethyl cyanide, is not low enough to test this hypothesis.
Finally, model A12 predicts a decrease of the deuterium fractionation of cyanoacetylene with time, but the value at the end of the Class 0 phase is still more than one order of magnitude higher than the one tentatively derived toward Sgr B2(N2).
6.3. The [CH2DOH]/[CH3OD] abundance ratio
If the deuteration of methanol were purely statistical, then one would expect CH2DOH to be three times more abundant than CH3OD because the methyl group contains three equivalent hydrogen atoms while the hydroxyl group has only one. Early chemical models producing methanol (and its deuterated species) on the surface of dust grains predicted such a value (Charnley et al. 1997). However various chemical processes have been shown or suggested to lead potentially to different values. Osamura et al. (2004) found theoretically that it is difficult to exchange protons and deuterons between the methyl and hydroxyl parts of methanol in the gas phase. Therefore, CH2DOH and CH3OD are distinct species that can have different chemical timescales. In particular, protonation of methanol in the gas phase (after sublimation) followed by dissociative recombination is thought to lead to a more rapid destruction of CH3OD compared to CH2DOH (Charnley et al. 1997). This process would increase the [CH2DOH]/[CH3OD] ratio after sublimation of methanol from the grain ices on a timescale of 105 yr for a temperature of 50 K and an H2 density of 106 cm-3 (Osamura et al. 2004). In contrast, at high temperature (100 K), the gas-phase model of Osamura et al. (2004) leads to a decrease of the [CH2DOH]/[CH3OD] ratio because the release of water and its deuterated isotopologue into the gas phase opens a new channel for the production of CH3OD via H2DO+. This model assumes a high initial [HDO]/[H2O] ratio of 0.1, however. The same study showed that, with an initial ratio of 0.01, [CH2DOH]/[CH3OD] remains roughly constant.
A preferential decrease of the abundance of CH3OD could also occur on the grains before desorption because hydrogenation of CH3OD by D–H exchange with water was experimentally shown to occur (above 120 K) while no equivalent process exists for CH2DOH (Ratajczak et al. 2009). Nagaoka et al. (2005) showed experimentally that the formation of deuterated methanol in interstellar ice analogs proceeds via H–D substitution of methanol with atomic D rather than successive addition of H and D on CO. The formation of CH3OD was not found to occur during this process, which Nagaoka et al. justify by invoking the higher barrier of H abstraction from a hydroxyl group compared to the H abstraction from a methyl group. Further constraints on the H/D addition/abstraction reactions on formaldehyde and methanol were obtained by Hidaka et al. (2009). Gas-grain coupled astrochemical models incorporating these new substitution and abstraction reactions on the grain surfaces indeed predict that an enhancement of the [CH2DOH]/[CH3OD] ratio beyond the statistical value can be reached at low temperature on a timescale depending on the density (>2 × 10⁴ yr for a density of ~5 × 106 cm-3, Taquet et al. 2012). At earlier times and/or lower densities, however, the [CH2DOH]/[CH3OD] ratio is predicted to have a low value of ~1.4. In a more recent version of this model that includes the spin of H2 in the chemical network and follows the dynamical evolution and warming up of a collapsing envelope, the [CH2DOH]/[CH3OD] ratio in the gas phase after sublimation is predicted to be ~1.5 (Taquet et al. 2014).
Observationally, CH3OD is found to be underabundant in the vicinity of low-mass protostars compared to the statistical expectation, with typical [CH2DOH]/[CH3OD] ratios in the range 7–13 (Parise et al. 2006, see footnote 7). Similar high ratios (6 and 13) were reported for two intermediate-mass protostars (Ratajczak et al. 2011)8. However, this ratio was found to be close to unity in Orion KL: Jacq et al. (1993) reported a ratio of 1.1–1.5 on the basis of selected transitions observed with the IRAM 30 m telescope; Peng et al. (2012) obtained a ratio of 0.7 ± 0.3 in the central region based on a few transitions mapped at high angular resolution with ALMA9; Neill et al. (2013) derived a ratio of 1.2 ± 0.3 toward the Compact Ridge based on the analysis of a complete line survey performed with Herschel. The upper limit of 0.6 obtained toward W3(H2O) (Ratajczak et al. 2011, see footnote 8) adds another piece of evidence suggesting that the [CH2DOH]/[CH3OD] ratio is significantly lower than the statistical value in high mass star-forming regions.
Our analysis of the ALMA spectrum of Sgr B2(N2) leads to [CH2DOH]/[CH3OD] > 1.8. This lower limit is consistent with the ratio derived for Orion KL by Neill et al. (2013) within the uncertainties (2σ). If the actual value in Sgr B2(N2) is close to this lower limit, then it would be a further indication that this ratio is indeed lower than the statistical value in the hot portions of regions forming high-mass stars, also in the Galactic center region. Taken at face value, however, our lower limit does not exclude a [CH2DOH]/[CH3OD] ratio in Sgr B2(N2) closer to (or even higher than) the statistical value.
The low [CH2DOH]/[CH3OD] ratio found in Orion KL and the lower limit obtained for Sgr B2(N2) are consistent with the value predicted by model T14. In this model, the ratio lies below the statistical value because of the abstraction reactions included in the chemical network following the experiments of Hidaka et al. (2009). These reactions occur only on the methyl group of methanol, and thus reduce the [CH2DOH]/[CH3OD] ratio.
6.4. Deuterium in the Galactic center region
With the only exception of methyl cyanide, the levels of deuterium fractionation derived for complex organic molecules in the Sgr B2(N2) hot core are all at least a factor four lower than those predicted by current gas-grain chemical models. Since deuteration is sensitive to temperature – a higher temperature implies a lower CO depletion and a higher ortho/para ratio of H2, which both limit the formation of H2D+ – the overall lower deuteration measured in Sgr B2(N2) may result from the somewhat higher temperatures measured in the Galactic center region: gas kinetic temperatures of 30–50 K were reported in dense clumps interferometrically traced with ammonia (Ott et al. 2014) and dust temperatures derived from infrared measurements with the Herschel Space Observatory lie in the range 20–28 K toward Sgr B2 (Guzmán et al. 2015)10. The two numerical studies to which we compared our results were focused on (low-mass) hot corinos that are embedded in colder regions: models T14 and A12 assume a dust temperature in the external layers of the protostellar envelope of 17 K and 10 K, respectively, and the temperature in the inner layers drops to 7 K and 5 K, respectively, just before the formation of the protostar. Changing the dust temperature has a significant impact on the deuteration in model T14: for instance, the degree of deuterium fractionation of methanol (CH2DOH) in the ices at the end of the prestellar phase was found to be reduced by a factor 2.8 when the external temperature is set to 20 K instead of 17 K (Taquet et al. 2014). Dedicated numerical simulations are thus needed to evaluate the effect of the dust temperature in the prestellar phase on the deuterium composition of hot cores in the Galactic center region.
Another explanation for the low deuteration level of complex organic molecules in Sgr B2(N2) could be the abundance of deuterium itself in the Galactic center region. Several studies (Jacq et al. 1990, 1999; Lubowich et al. 2000; Polehampton et al. 2002) suggested that deuterium may be up to ~10 times less abundant in the Galactic center region than in the local interstellar medium owing to stellar processing. The levels of COM deuteration found in Sgr B2(N2) are indeed systematically lower (by a factor of a few up to a factor ~10) than those reported in the Orion-KL Hot Core or Compact Ridge. While a chemical or evolutionary origin for this difference cannot be excluded without further modeling, the low deuteration level of complex organic molecules in Sgr B2(N2) may result from deuterium being less abundant in the Galactic center region by maybe up to a factor ten.
7. Conclusions
We searched for deuterated complex organic molecules in a complete 3-mm interferometric line survey performed toward the hot core Sgr B2(N2) with ALMA. We report the secure detection of CH2DCN and tentative detections of CH2DOH, CH2DCH2CN in its out-of-plane conformation, the chiral molecule CH3CHDCN, and DC3N. We also derive column density upper limits for CH3OD, CH2DCH2CN in its in-plane conformation, the three deuterated isotopologues of vinyl cyanide, the four deuterated species of ethanol, and CH2DOCHO in its in-plane and out-of-plane conformations. The detections are characterized by compact emission consistent with a hot-core origin. We obtain a deuterium fractionation level of 0.4% for CH2DCN and values between 0.05% and 0.12% for the other (tentatively detected) species. Stringent upper limits are derived for the in-plane conformer of CH2DCH2CN (<0.024%) and CH3OD (<0.07%). The deuteration upper limits for the other nondetected deuterated species lie in the range 0.5–1.8%.
The following conclusions arise from this analysis:
-
1.
Ethyl cyanide is less deuterated than methyl cyanide by at least a factor five. This may be due to their different formation pathways (grain surface versus gas phase).
-
2.
The relative abundances of the three deuterated species of ethyl cyanide are most likely consistent with a statistical distribution.
-
3.
The [CH2DOH]/[CH3OD] abundance ratio in Sgr B2(N2) is higher than 1.8. It may still be consistent with the value obtained in Orion KL but a value closer to (or, as in low-mass Class 0 protostars, even higher than) the statistical value cannot be excluded.
-
4.
Except for methyl cyanide, the levels of deuterium fractionation measured toward the hot core Sgr B2(N2) lie at least a factor four below the predictions of current astrochemical models that were designed for lower mass objects (hot corinos in the Class 0 phase).
-
5.
The levels of deuterium fractionation derived for complex organic molecules in Sgr B2(N2) are lower by a factor of a few up to a factor ten than in the Orion-KL Hot Core or Compact Ridge.
The discrepancy between the deuteration levels measured in Sgr B2(N2) and the predictions of current chemical models for complex organic molecules, and the difference between Sgr B2(N2) and Orion KL may both be due to the higher kinetic temperatures that prevail in the Galactic center region compared to nearby star-forming regions. Dedicated numerical simulations are needed to test this hypothesis. An alternative explanation for the low deuteration level of complex organic molecules in Sgr B2(N2) could be a lower abundance of deuterium itself in the Galactic center region by up to a factor ten, as was also suggested by previous studies based on smaller molecules.
We adopt the definition of Herbst & van Dishoeck (2009): a complex organic molecule is an organic molecule containing six atoms or more.
They were named P1 and P2 in Belloche et al. (2008) and SMA1 and SMA2 in Qin et al. (2011).
The current model is somewhat inconsistent with the observed spectrum at 92 129 MHz (blend of ν7 = 410-2 – 92 and 104 – 94) and 100 431 MHz (ν5 = ν7 = 1l = 0−110 – 100) but this is most likely due to resonant interactions between ν7 = 4 and ν5 = ν7 = 1, which are not well accounted for in the spectroscopic predictions. The frequencies of these transitions may well be off by a few MHz (see CDMS documentation and Sect. 4.4.33 of Belloche et al. 2013).
There was an issue with the spectroscopic predictions used in the early studies reporting CH2DOH column densities (B. Parise, priv. comm.). We compared the Sμ2 values listed in Table 1 of Parise et al. (2002), which were also used in Parise et al. (2006), with the current JPL catalog. The new values of the selected transitions are a factor 2.1 ± 0.4 times higher on average than the old values. The partition function is the same in both cases. As a result, the column densities reported for CH2DOH in both articles were overestimated by a factor of ~2.
We have divided the ratios by 1.5 because the CH2DOH column densities reported by Ratajczak et al. (2011) are affected by the same issue as described in footnote 7. We use the ratios reported by the authors based on the transition 303–202 E0, which has a Sμ2 value in their Table A.1 1.5 times lower than in the current JPL catalog.
Neill et al. (2013) pointed out that the use of more recent spectroscopic predictions for CH2DOH would lead to a higher ratio of approximately 1.
However, high-density material with lower dust temperatures may exist and be masked by warmer, outer layers traced with Herschel.
Acknowledgments
We thank Bérengère Parise for enlightening discussions about deuterium fractionation. This work has been supported in part by the Deutsche Forschungsgemeinschaft through the collaborative research grant SFB 956 “Conditions and Impact of Star Formation”, project area B3. R.T.G. acknowledges support from the NASA Astrophysics Theory Program through grant NNX11AC38G. This paper makes use of the following ALMA data: ADS/JAO.ALMA#2011.0.00017.S, ADS/JAO.ALMA#2012.1.00012.S. ALMA is a partnership of ESO (representing its member states), NSF (USA) and NINS (Japan), together with NRC (Canada), NSC and ASIAA (Taiwan), and KASI (Republic of Korea), in cooperation with the Republic of Chile. The Joint ALMA Observatory is operated by ESO, AUI/NRAO and NAOJ. The interferometric data are available in the ALMA archive at https://almascience.eso.org/aq/.
References
- Aikawa, Y., Wakelam, V., Hersant, F., Garrod, R. T., & Herbst, E. 2012, ApJ, 760, 40 [NASA ADS] [CrossRef] [Google Scholar]
- Anderson, T., Crownover, R. L., Herbst, E., & De Lucia, F. C. 1988, ApJS, 67, 135 [NASA ADS] [CrossRef] [Google Scholar]
- Baskakov, O. I., Dyubko, S. F., Ilyushin, V. V., et al. 1996, J. Mol. Spectrosc., 179, 94 [Google Scholar]
- Bauer, A. 1971, J. Mol. Spectrosc., 40, 183 [NASA ADS] [CrossRef] [Google Scholar]
- Bauer, A., & Maes, S. 1969, J. Phys. (Paris), 30, 169 [CrossRef] [EDP Sciences] [Google Scholar]
- Belloche, A., Menten, K. M., Comito, C., et al. 2008, A&A, 482, 179 [NASA ADS] [CrossRef] [EDP Sciences] [Google Scholar]
- Belloche, A., Garrod, R. T., Müller, H. S. P., et al. 2009, A&A, 499, 215 [NASA ADS] [CrossRef] [EDP Sciences] [Google Scholar]
- Belloche, A., Müller, H. S. P., Menten, K. M., Schilke, P., & Comito, C. 2013, A&A, 559, A47 [NASA ADS] [CrossRef] [EDP Sciences] [Google Scholar]
- Belloche, A., Garrod, R. T., Müller, H. S. P., & Menten, K. M. 2014, Science, 345, 1584 [NASA ADS] [CrossRef] [PubMed] [Google Scholar]
- Brauer, C. S., Pearson, J. C., Drouin, B. J., & Yu, S. 2009, ApJS, 184, 133 [NASA ADS] [CrossRef] [Google Scholar]
- Caselli, P., & Ceccarelli, C. 2012, A&ARv, 20, 56 [NASA ADS] [CrossRef] [MathSciNet] [Google Scholar]
- Caselli, P., Hasegawa, T. I., & Herbst, E. 1993, ApJ, 408, 548 [NASA ADS] [CrossRef] [Google Scholar]
- Cazzoli, G., & Kisiel, Z. 1988, J. Mol. Spectrosc., 130, 303 [NASA ADS] [CrossRef] [Google Scholar]
- Ceccarelli, C., Caselli, P., Bockelée-Morvan, D., et al. 2014, Protostars and Planets VI, 859 [Google Scholar]
- Charnley, S. B., Tielens, A. G. G. M., & Rodgers, S. D. 1997, ApJ, 482, L203 [NASA ADS] [CrossRef] [Google Scholar]
- Colmont, J. M., Wlodarczak, G., Priem, D., et al. 1997, J. Mol. Spectrosc., 181, 330 [NASA ADS] [CrossRef] [Google Scholar]
- Comito, C., Schilke, P., Gerin, M., et al. 2003, A&A, 402, 635 [NASA ADS] [CrossRef] [EDP Sciences] [Google Scholar]
- Coudert, L. H., Drouin, B. J., Tercero, B., et al. 2013, ApJ, 779, 119 [NASA ADS] [CrossRef] [Google Scholar]
- Creswell, R. A., Winnewisser, G., & Gerry, M. C. L. 1977, J. Mol. Spectrosc., 65, 420 [CrossRef] [Google Scholar]
- Daly, A. M., Bermúdez, C., López, A., et al. 2013, ApJ, 768, 81 [NASA ADS] [CrossRef] [Google Scholar]
- Demaison, J., Dubrulle, A., Boucher, D., Burie, J., & Typke, V. 1979, J. Mol. Spectrosc., 76, 1 [NASA ADS] [CrossRef] [Google Scholar]
- Duan, Y.-B., Ozier, I., Tsunekawa, S., & Takagi, K. 2003, J. Mol. Spectrosc., 218, 95 [Google Scholar]
- Esplugues, G. B., Cernicharo, J., Viti, S., et al. 2013, A&A, 559, A51 [NASA ADS] [CrossRef] [EDP Sciences] [Google Scholar]
- Favre, C., Carvajal, M., Field, D., et al. 2014, ApJS, 215, 25 [NASA ADS] [CrossRef] [Google Scholar]
- Fayt, A., Vigouroux, C., Willaert, F., et al. 2004, J. Mol. Struct., 695, 295 [NASA ADS] [Google Scholar]
- Fontani, F., Busquet, G., Palau, A., et al. 2015, A&A, 575, A87 [NASA ADS] [CrossRef] [EDP Sciences] [Google Scholar]
- Fuente, A., Cernicharo, J., Caselli, P., et al. 2014, A&A, 568, A65 [NASA ADS] [CrossRef] [EDP Sciences] [Google Scholar]
- Fukuyama, Y., Odashima, H., Takagi, K., & Tsunekawa, S. 1996, ApJS, 104, 329 [NASA ADS] [CrossRef] [Google Scholar]
- Garrod, R. T. 2013, ApJ, 765, 60 [Google Scholar]
- Garrod, R. T., Weaver, S. L. W., & Herbst, E. 2008, ApJ, 682, 283 [NASA ADS] [CrossRef] [Google Scholar]
- Gerin, M., Combes, F., Wlodarczak, G., et al. 1992, A&A, 259, L35 [NASA ADS] [Google Scholar]
- Goldsmith, P. F., & Langer, W. D. 1999, ApJ, 517, 209 [NASA ADS] [CrossRef] [Google Scholar]
- Gottlieb, C. A., Ball, J. A., Gottlieb, E. W., & Dickinson, D. F. 1979, ApJ, 227, 422 [NASA ADS] [CrossRef] [Google Scholar]
- Guzmán, A., Sanhueza, P., Contreras, Y., et al. 2015, ApJ, 815, 130 [NASA ADS] [CrossRef] [Google Scholar]
- Heise, H. M., Winther, F., & Lutz, H. 1981, J. Mol. Spectrosc., 90, 531 [NASA ADS] [CrossRef] [Google Scholar]
- Herbst, E., & van Dishoeck, E. F. 2009, ARA&A, 47, 427 [NASA ADS] [CrossRef] [Google Scholar]
- Hidaka, H., Watanabe, M., Kouchi, A., & Watanabe, N. 2009, ApJ, 702, 291 [NASA ADS] [CrossRef] [Google Scholar]
- Howe, D. A., Millar, T. J., Schilke, P., & Walmsley, C. M. 1994, MNRAS, 267, 59 [NASA ADS] [Google Scholar]
- Ilyushin, V., Kryvda, A., & Alekseev, E. 2009, J. Mol. Spectrosc., 255, 32 [Google Scholar]
- Jacq, T., Walmsley, C. M., Henkel, C., et al. 1990, A&A, 228, 447 [NASA ADS] [Google Scholar]
- Jacq, T., Walmsley, C. M., Mauersberger, R., et al. 1993, A&A, 271, 276 [NASA ADS] [Google Scholar]
- Jacq, T., Baudry, A., Walmsley, C. M., & Caselli, P. 1999, A&A, 347, 957 [NASA ADS] [Google Scholar]
- Kisiel, Z., Martin-Drumel, M. A., & Pirali, O. 2015, J. Mol. Spectrosc., 315, 83 [Google Scholar]
- Langer, W. D., Schloerb, F. P., Snell, R. L., & Young, J. S. 1980, ApJ, 239, L125 [NASA ADS] [CrossRef] [Google Scholar]
- Lauvergnat, D., Coudert, L. H., Klee, S., & Smirnov, M. 2009, J. Mol. Spectrosc., 256, 204 [Google Scholar]
- Linsky, J. L. 2003, Space Sci. Rev., 106, 49 [NASA ADS] [CrossRef] [Google Scholar]
- Lubowich, D. A., Pasachoff, J. M., Balonek, T. J., et al. 2000, Nature, 405, 1025 [NASA ADS] [CrossRef] [PubMed] [Google Scholar]
- Maret, S., Hily-Blant, P., Pety, J., Bardeau, S., & Reynier, E. 2011, A&A, 526, A47 [NASA ADS] [CrossRef] [EDP Sciences] [Google Scholar]
- Margulès, L., Motiyenko, R., Demyk, K., et al. 2009, A&A, 493, 565 [NASA ADS] [CrossRef] [EDP Sciences] [Google Scholar]
- Müller, H. S. P., Thorwirth, S., Roth, D. A., & Winnewisser, G. 2001, A&A, 370, L49 [NASA ADS] [CrossRef] [EDP Sciences] [Google Scholar]
- Müller, H. S. P., Schlöder, F., Stutzki, J., & Winnewisser, G. 2005, J. Mol. Struct., 742, 215 [NASA ADS] [CrossRef] [Google Scholar]
- Müller, H. S. P., Belloche, A., Menten, K. M., Comito, C., & Schilke, P. 2008, J. Mol. Spectrosc., 251, 319 [CrossRef] [Google Scholar]
- Müller, H. S. P., Drouin, B. J., & Pearson, J. C. 2009, A&A, 506, 1487 [NASA ADS] [CrossRef] [EDP Sciences] [Google Scholar]
- Müller, H. S. P., Brown, L. R., Drouin, B. J., et al. 2015, J. Mol. Spectrosc., 312, 22 [CrossRef] [Google Scholar]
- Müller, H. S. P., Drouin, B. J., & Pearson, J. C., et al. 2016a, A&A, 586, A17 [NASA ADS] [CrossRef] [EDP Sciences] [Google Scholar]
- Müller, H. S. P., Belloche, A., Xu, L.-H., et al. 2016b, A&A, 587, A92 [NASA ADS] [CrossRef] [EDP Sciences] [Google Scholar]
- Nagaoka, A., Watanabe, N., & Kouchi, A. 2005, ApJ, 624, L29 [NASA ADS] [CrossRef] [Google Scholar]
- Neill, J. L., Crockett, N. R., Bergin, E. A., Pearson, J. C., & Xu, L.-H. 2013, ApJ, 777, 85 [NASA ADS] [CrossRef] [Google Scholar]
- Nguyen, L., Walters, A., Margulès, L., et al. 2013, A&A, 553, A84 [NASA ADS] [CrossRef] [EDP Sciences] [Google Scholar]
- Osamura, Y., Roberts, H., & Herbst, E. 2004, A&A, 421, 1101 [NASA ADS] [CrossRef] [EDP Sciences] [Google Scholar]
- Ott, J., Weiß, A., Staveley-Smith, L., Henkel, C., & Meier, D. S. 2014, ApJ, 785, 55 [NASA ADS] [CrossRef] [Google Scholar]
- Parise, B., Ceccarelli, C., Tielens, A. G. G. M., et al. 2002, A&A, 393, L49 [NASA ADS] [CrossRef] [EDP Sciences] [Google Scholar]
- Parise, B., Castets, A., Herbst, E., et al. 2004, A&A, 416, 159 [NASA ADS] [CrossRef] [EDP Sciences] [Google Scholar]
- Parise, B., Ceccarelli, C., Tielens, A. G. G. M., et al. 2006, A&A, 453, 949 [NASA ADS] [CrossRef] [EDP Sciences] [Google Scholar]
- Parise, B., Leurini, S., Schilke, P., et al. 2009, A&A, 508, 737 [NASA ADS] [CrossRef] [EDP Sciences] [Google Scholar]
- Pearson, J. C., Yu, S., & Drouin, B. J. 2012, J. Mol. Spectrosc., 280, 119 [NASA ADS] [CrossRef] [Google Scholar]
- Peng, T.-C., Despois, D., Brouillet, N., Parise, B., & Baudry, A. 2012, A&A, 543, A152 [NASA ADS] [CrossRef] [EDP Sciences] [Google Scholar]
- Pickett, H. M., Poynter, R. L., Cohen, E. A., et al. 1998, J. Quant. Spectr. Rad. Transf., 60, 883 [NASA ADS] [CrossRef] [Google Scholar]
- Pillai, T., Wyrowski, F., Hatchell, J., Gibb, A. G., & Thompson, M. A. 2007, A&A, 467, 207 [NASA ADS] [CrossRef] [EDP Sciences] [Google Scholar]
- Polehampton, E. T., Baluteau, J.-P., Ceccarelli, C., Swinyard, B. M., & Caux, E. 2002, A&A, 388, L44 [NASA ADS] [CrossRef] [EDP Sciences] [Google Scholar]
- Qin, S.-L., Schilke, P., Rolffs, R., et al. 2011, A&A, 530, L9 [NASA ADS] [CrossRef] [EDP Sciences] [Google Scholar]
- Ratajczak, A., Quirico, E., Faure, A., Schmitt, B., & Ceccarelli, C. 2009, A&A, 496, L21 [NASA ADS] [CrossRef] [EDP Sciences] [Google Scholar]
- Ratajczak, A., Taquet, V., Kahane, C., et al. 2011, A&A, 528, L13 [NASA ADS] [CrossRef] [EDP Sciences] [Google Scholar]
- Reid, M. J., Menten, K. M., Brunthaler, A., et al. 2014, ApJ, 783, 130 [Google Scholar]
- Remijan, A., et al. 2015, ALMA Cycle 3 Technical Handbook Version 1.0, ALMA [Google Scholar]
- Richard, C., Margulès, L., Motiyenko, R. A., & Guillemin, J.-C. 2012, A&A, 543, A135 [NASA ADS] [CrossRef] [EDP Sciences] [Google Scholar]
- Rolffs, R., Schilke, P., Wyrowski, F., et al. 2011, A&A, 527, A68 [NASA ADS] [CrossRef] [EDP Sciences] [Google Scholar]
- Sakai, N., Sakai, T., Hirota, T., & Yamamoto, S. 2009, ApJ, 702, 1025 [NASA ADS] [CrossRef] [Google Scholar]
- Spahn, H., Müller, H. S. P., Giesen, T. F., et al. 2008, Chem. Phys., 346, 132 [NASA ADS] [CrossRef] [Google Scholar]
- Taquet, V., Ceccarelli, C., & Kahane, C. 2012, ApJ, 748, L3 [NASA ADS] [CrossRef] [Google Scholar]
- Taquet, V., Charnley, S. B., & Sipilä, O. 2014, ApJ, 791, 1 [NASA ADS] [CrossRef] [Google Scholar]
- Thorwirth, S., Müller, H. S. P., & Winnewisser, G. 2000, J. Mol. Spectrosc., 204 133 [NASA ADS] [CrossRef] [Google Scholar]
- Thorwirth, S., Müller, H. S. P., & Winnewisser, G. 2001, Phys. Chem. Chem. Phys., 3, 1236 [CrossRef] [Google Scholar]
- Turner, B. E. 2001, ApJS, 136, 579 [Google Scholar]
- Uyemura, M., Deguchi, S., Nakada, Y., & Onaka, T. 1982, Bull. Chem. Soc. Jpn., 55, 384 [Google Scholar]
- Walters, A., Schäfer, M., Ordu, M. H., et al. 2015, J. Mol. Spectrosc., 314, 6 [Google Scholar]
- Watanabe, Y., Sakai, N., López-Sepulcre, A., et al. 2015, ApJ, 809, 162 [NASA ADS] [CrossRef] [Google Scholar]
- Yamada, K. M. T., & Creswell, R. A. 1986, J. Mol. Spectrosc., 116, 384 [NASA ADS] [CrossRef] [Google Scholar]
Appendix A: Additional figures
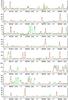 |
Fig. A.1 Transitions of C2H5CN, ν= 0 covered by our ALMA survey. The best-fit LTE synthetic spectrum of C2H5CN is displayed in red and overlaid on the observed spectrum of Sgr B2(N2) shown in black. The green synthetic spectrum contains the contributions of all molecules identified in our survey so far, including the species shown in red. The central frequency and width are indicated in MHz below each panel. The angular resolution (HPBW) is also indicated. The y-axis is labeled in brightness temperature units (K). The dotted line indicates the 3σ noise level. |
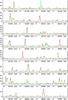 |
Fig. A.1 continued. |
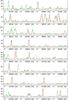 |
Fig. A.1 continued. |
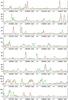 |
Fig. A.1 continued. |
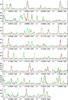 |
Fig. A.1 continued. |
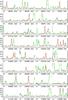 |
Fig. A.2 continued. |
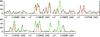 |
Fig. A.2 continued. |

 |
Fig. A.3 continued. |
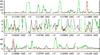 |
Fig. A.3 continued. |

 |
Fig. A.4 continued. |
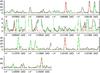 |
Fig. A.4 continued. |
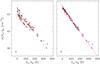 |
Fig. A.6 Population diagram of C2H5CN, ν= 0 toward Sgr B2(N2). Only the lines that are clearly detected, do not suffer too much from contamination from other species, and have an opacity below 2.5 are displayed. The observed datapoints are shown in black while the synthetic populations are shown in red. No correction is applied in panel a). In panel b), the optical depth correction has been applied to both the observed and synthetic populations and the contamination from all other species included in the full model has been removed from the observed datapoints. The purple line is a linear fit to the observed populations (in linear-logarithmic space). |
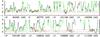 |
Fig. A.12 Same as Fig. A.1 for CH2DCH2CN in its in-plane conformation. The full synthetic model (in green) does not contain any contribution of CH2DCH2CN in its in-plane conformation (in red). |
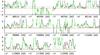 |
Fig. A.58 Same as Fig. A.1 for CH3OD, ν= 0. The full synthetic model (in green) does not contain any contribution of CH3OD (in red). |
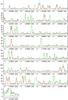 |
Fig. A.59 continued. |
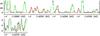 |
Fig. A.60 continued. |
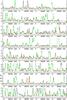 |
Fig. A.70 continued. |
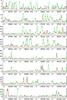 |
Fig. A.70 continued. |
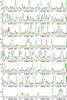 |
Fig. A.70 continued. |
 |
Fig. A.70 continued. |
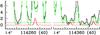 |
Fig. A.70 continued. |
 |
Fig. A.71 continued. |
 |
Fig. A.71 continued. |
 |
Fig. A.71 continued. |
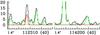 |
Fig. A.71 continued. |
All Tables
Rotational temperatures derived from population diagrams of selected (complex) organic molecules toward Sgr B2(N2).
Parameters of our best-fit LTE model (or upper limit) of selected (complex) organic molecules toward Sgr B2(N2).
Deuterium fractionation of selected (complex) organic molecules toward Sgr B2(N2) compared to predictions of astrochemical models.
All Figures
|
Fig. 1 Deconvolved major, minor, and mean sizes (FWHM) derived for uncontaminated C2H5CN transitions detected toward Sgr B2(N2) and plotted as a function of upper level energy. The symbols code for the spectral setup (S1 to S5, like in Table 2). In each panel, the dashed line indicates the median value. |
| In the text | |
|
Fig. 2 Deuterium fractionation of (complex) organic molecules toward Sgr B2(N2). Secure detections are indicated with a filled square, tentative detections with an empty square, and upper limits with an arrow pointing to the left. The notations oop and ip describe the position of the deuterium and stand for out of plane and in plane, respectively. |
| In the text | |
|
Fig. A.1 Transitions of C2H5CN, ν= 0 covered by our ALMA survey. The best-fit LTE synthetic spectrum of C2H5CN is displayed in red and overlaid on the observed spectrum of Sgr B2(N2) shown in black. The green synthetic spectrum contains the contributions of all molecules identified in our survey so far, including the species shown in red. The central frequency and width are indicated in MHz below each panel. The angular resolution (HPBW) is also indicated. The y-axis is labeled in brightness temperature units (K). The dotted line indicates the 3σ noise level. |
| In the text | |
|
Fig. A.1 continued. |
| In the text | |
|
Fig. A.1 continued. |
| In the text | |
|
Fig. A.1 continued. |
| In the text | |
|
Fig. A.1 continued. |
| In the text | |
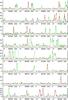 |
Fig. A.2 Same as Fig. A.1 for 13CH3CH2CN, ν= 0. |
| In the text | |
|
Fig. A.2 continued. |
| In the text | |
|
Fig. A.2 continued. |
| In the text | |
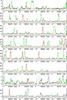 |
Fig. A.3 Same as Fig. A.1 for
CH |
| In the text | |
|
Fig. A.3 continued. |
| In the text | |
|
Fig. A.3 continued. |
| In the text | |
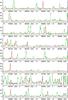 |
Fig. A.4 Same as Fig. A.1 for CH3CH |
| In the text | |
|
Fig. A.4 continued. |
| In the text | |
|
Fig. A.4 continued. |
| In the text | |
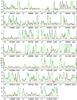 |
Fig. A.5 Same as Fig. A.1 for C2H5C15N, ν= 0. |
| In the text | |
|
Fig. A.6 Population diagram of C2H5CN, ν= 0 toward Sgr B2(N2). Only the lines that are clearly detected, do not suffer too much from contamination from other species, and have an opacity below 2.5 are displayed. The observed datapoints are shown in black while the synthetic populations are shown in red. No correction is applied in panel a). In panel b), the optical depth correction has been applied to both the observed and synthetic populations and the contamination from all other species included in the full model has been removed from the observed datapoints. The purple line is a linear fit to the observed populations (in linear-logarithmic space). |
| In the text | |
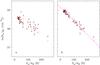 |
Fig. A.7 Same as Fig. A.6 for 13CH3CH2CN, ν= 0. |
| In the text | |
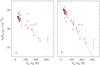 |
Fig. A.8 Same as Fig. A.6 for
CH |
| In the text | |
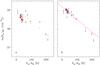 |
Fig. A.9 Same as Fig. A.6 for CH3CH |
| In the text | |
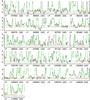 |
Fig. A.10 Same as Fig. A.1 for CH3CHDCN. |
| In the text | |
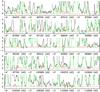 |
Fig. A.11 Same as Fig. A.1 for CH2DCH2CN in its out-of-plane conformation. |
| In the text | |
|
Fig. A.12 Same as Fig. A.1 for CH2DCH2CN in its in-plane conformation. The full synthetic model (in green) does not contain any contribution of CH2DCH2CN in its in-plane conformation (in red). |
| In the text | |
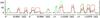 |
Fig. A.13 Same as Fig. A.1 for CH3CN, ν= 0. |
| In the text | |
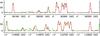 |
Fig. A.14 Same as Fig. A.1 for CH3CN, ν8 = 1. |
| In the text | |
 |
Fig. A.15 Same as Fig. A.1 for CH3CN, ν8 = 2. |
| In the text | |
 |
Fig. A.16 Same as Fig. A.1 for CH3CN, ν4 = 1. |
| In the text | |
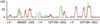 |
Fig. A.17 Same as Fig. A.1 for 13CH3CN, ν= 0. |
| In the text | |
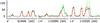 |
Fig. A.18 Same as Fig. A.1 for
CH |
| In the text | |
 |
Fig. A.19 Same as Fig. A.1 for 13CH3CN, ν8 = 1. |
| In the text | |
 |
Fig. A.20 Same as Fig. A.1 for
CH |
| In the text | |
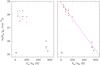 |
Fig. A.21 Same as Fig. A.6 for 13CH3CN, ν= 0 and ν8 = 1. |
| In the text | |
 |
Fig. A.22 Same as Fig. A.6 for
CH |
| In the text | |
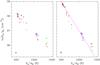 |
Fig. A.23 Same as Fig. A.6 for CH3CN, ν8 = 1, ν8 = 2, and ν4 = 1. |
| In the text | |
 |
Fig. A.24 Same as Fig. A.1 for 13CH |
| In the text | |
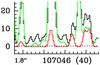 |
Fig. A.25 Same as Fig. A.1 for CH3C15N, ν= 0. |
| In the text | |
 |
Fig. A.26 Same as Fig. A.1 for CH2DCN, ν= 0. |
| In the text | |
 |
Fig. A.27 Same as Fig. A.6 for CH2DCN. |
| In the text | |
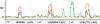 |
Fig. A.28 Same as Fig. A.1 for HC3N, ν= 0. |
| In the text | |
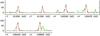 |
Fig. A.29 Same as Fig. A.1 for HC3N, ν7 = 1. |
| In the text | |
 |
Fig. A.30 Same as Fig. A.1 for HC3N, ν7 = 2. |
| In the text | |
 |
Fig. A.31 Same as Fig. A.1 for HC3N, ν6 = 1. |
| In the text | |
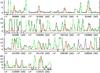 |
Fig. A.32 Same as Fig. A.1 for HC3N, ν5 = 1 and ν7 = 3. |
| In the text | |
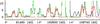 |
Fig. A.33 Same as Fig. A.1 for HC3N, ν6 = ν7 = 1. |
| In the text | |
 |
Fig. A.34 Same as Fig. A.1 for HC3N, ν4 = 1. |
| In the text | |
 |
Fig. A.35 Same as Fig. A.1 for HC3N, ν7 = 4 and ν5 = ν7 = 1. |
| In the text | |
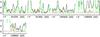 |
Fig. A.36 Same as Fig. A.1 for HC3N, ν6 = 2. |
| In the text | |
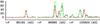 |
Fig. A.37 Same as Fig. A.1 for H13CCCN, ν= 0. |
| In the text | |
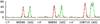 |
Fig. A.38 Same as Fig. A.1 for HC13CCN, ν= 0. |
| In the text | |
 |
Fig. A.39 Same as Fig. A.1 for HCC13CN, ν= 0. |
| In the text | |
 |
Fig. A.40 Same as Fig. A.1 for H13CCCN, ν7 = 1. |
| In the text | |
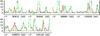 |
Fig. A.41 Same as Fig. A.1 for HC13CCN, ν7 = 1. |
| In the text | |
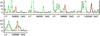 |
Fig. A.42 Same as Fig. A.1 for HCC13CN, ν7 = 1. |
| In the text | |
 |
Fig. A.43 Same as Fig. A.1 for HC13CCN, ν7 = 2. |
| In the text | |
 |
Fig. A.44 Same as Fig. A.1 for H13CCCN, ν7 = 2. |
| In the text | |
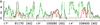 |
Fig. A.45 Same as Fig. A.1 for HCC13CN, ν7 = 2. |
| In the text | |
 |
Fig. A.46 Same as Fig. A.1 for HC13CCN, ν6 = 1. |
| In the text | |
 |
Fig. A.47 Same as Fig. A.1 for HCC13CN, ν6 = 1. |
| In the text | |
 |
Fig. A.48 Same as Fig. A.1 for H13CCCN, ν6 = 1. |
| In the text | |
 |
Fig. A.49 Same as Fig. A.1 for H13C13CCN, ν= 0. |
| In the text | |
 |
Fig. A.50 Same as Fig. A.1 for HC13C13CN, ν= 0. |
| In the text | |
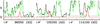 |
Fig. A.51 Same as Fig. A.1 for H13CC13CN, ν= 0. |
| In the text | |
 |
Fig. A.52 Same as Fig. A.1 for
HC |
| In the text | |
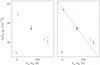 |
Fig. A.53 Same as Fig. A.6 for H13CCCN, ν= 0, ν7 = 1, ν7 = 2, and ν6 = 1. |
| In the text | |
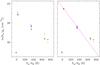 |
Fig. A.54 Same as Fig. A.6 for HC13CCN, ν= 0, ν7 = 1, ν7 = 2, and ν6 = 1. |
| In the text | |
 |
Fig. A.55 Same as Fig. A.6 for HCC13CN, ν= 0, ν7 = 1, ν7 = 2, and ν6 = 1. |
| In the text | |
 |
Fig. A.56 Same as Fig. A.1 for DC3N, ν= 0. |
| In the text | |
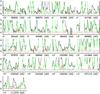 |
Fig. A.57 Same as Fig. A.1 for CH2DOH, ν= 0. |
| In the text | |
|
Fig. A.58 Same as Fig. A.1 for CH3OD, ν= 0. The full synthetic model (in green) does not contain any contribution of CH3OD (in red). |
| In the text | |
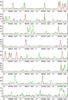 |
Fig. A.59 Same as Fig. A.1 for C2H3CN, ν= 0. |
| In the text | |
|
Fig. A.59 continued. |
| In the text | |
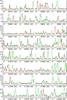 |
Fig. A.60 Same as Fig. A.1 for C2H3CN, ν11 = 1. |
| In the text | |
|
Fig. A.60 continued. |
| In the text | |
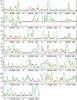 |
Fig. A.61 Same as Fig. A.1 for C2H3CN, ν15 = 1. |
| In the text | |
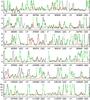 |
Fig. A.62 Same as Fig. A.1 for C2H3CN, ν11 = 2. |
| In the text | |
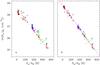 |
Fig. A.63 Same as Fig. A.6 for C2H3CN, ν= 0, ν11 = 1, ν15 = 1, and ν11 = 2. |
| In the text | |
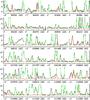 |
Fig. A.64 Same as Fig. A.1 for 13CH2CHCN, ν= 0. |
| In the text | |
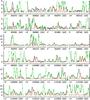 |
Fig. A.65 Same as Fig. A.1 for
CH |
| In the text | |
 |
Fig. A.66 Same as Fig. A.1 for C2H |
| In the text | |
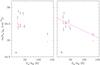 |
Fig. A.67 Same as Fig. A.6 for 13CH2CHCN, ν= 0. |
| In the text | |
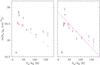 |
Fig. A.68 Same as Fig. A.6 for
CH |
| In the text | |
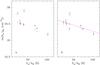 |
Fig. A.69 Same as Fig. A.6 for CH2CH13CN, ν= 0. |
| In the text | |
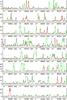 |
Fig. A.70 Same as Fig. A.1 for CH3OCHO, νt = 0. |
| In the text | |
|
Fig. A.70 continued. |
| In the text | |
|
Fig. A.70 continued. |
| In the text | |
|
Fig. A.70 continued. |
| In the text | |
|
Fig. A.70 continued. |
| In the text | |
|
Fig. A.70 continued. |
| In the text | |
 |
Fig. A.71 Same as Fig. A.1 for CH3OCHO, νt = 1. |
| In the text | |
|
Fig. A.71 continued. |
| In the text | |
|
Fig. A.71 continued. |
| In the text | |
|
Fig. A.71 continued. |
| In the text | |
|
Fig. A.71 continued. |
| In the text | |
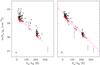 |
Fig. A.72 Same as Fig. A.6 for CH3OCHO, νt = 0 and νt = 1. |
| In the text | |
Current usage metrics show cumulative count of Article Views (full-text article views including HTML views, PDF and ePub downloads, according to the available data) and Abstracts Views on Vision4Press platform.
Data correspond to usage on the plateform after 2015. The current usage metrics is available 48-96 hours after online publication and is updated daily on week days.
Initial download of the metrics may take a while.