Fig. 8
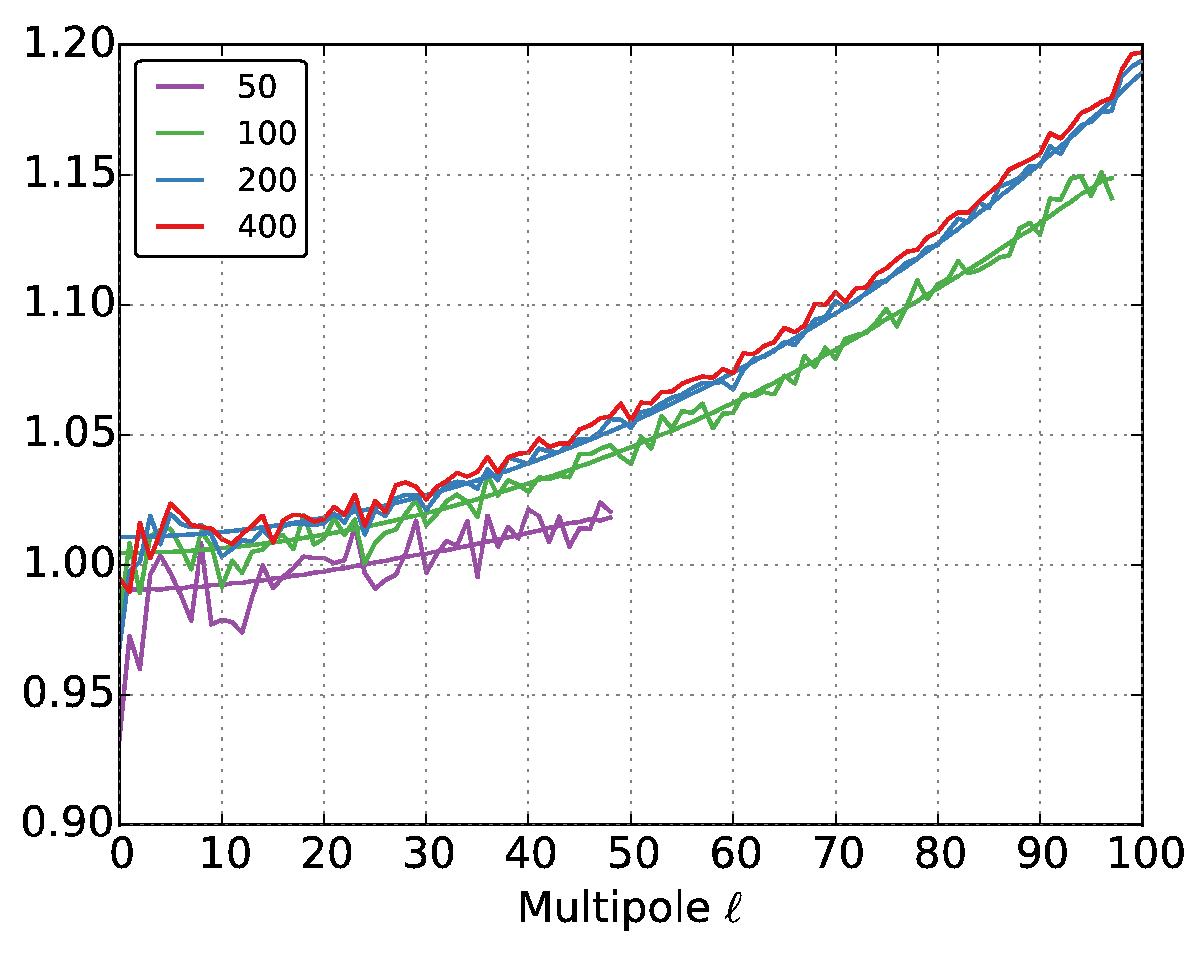
Effect of ℓmax parameter on 30 GHz TT white noise spectrum. We deconvolve the same data set with ℓmax = 50, 100, 200, 400. To reduce scatter, we divide each spectrum by the white noise map spectrum, and show them in dimensionless units. The plot is based on 40 Monte Carlo realizations. The smooth lines in same colour show the predicted noise bias, constructed from harmonic white noise covariance matrix, for ℓmax = 50, 100, 200. To bring them into units comparable with the Monte Carlo spectra, we divide them by the white noise level 3.2180 × 10⁻¹⁵ K2 (from Table 3). The last 2−5 unreliable multipoles are excluded for clarity.
Current usage metrics show cumulative count of Article Views (full-text article views including HTML views, PDF and ePub downloads, according to the available data) and Abstracts Views on Vision4Press platform.
Data correspond to usage on the plateform after 2015. The current usage metrics is available 48-96 hours after online publication and is updated daily on week days.
Initial download of the metrics may take a while.