Fig. 25
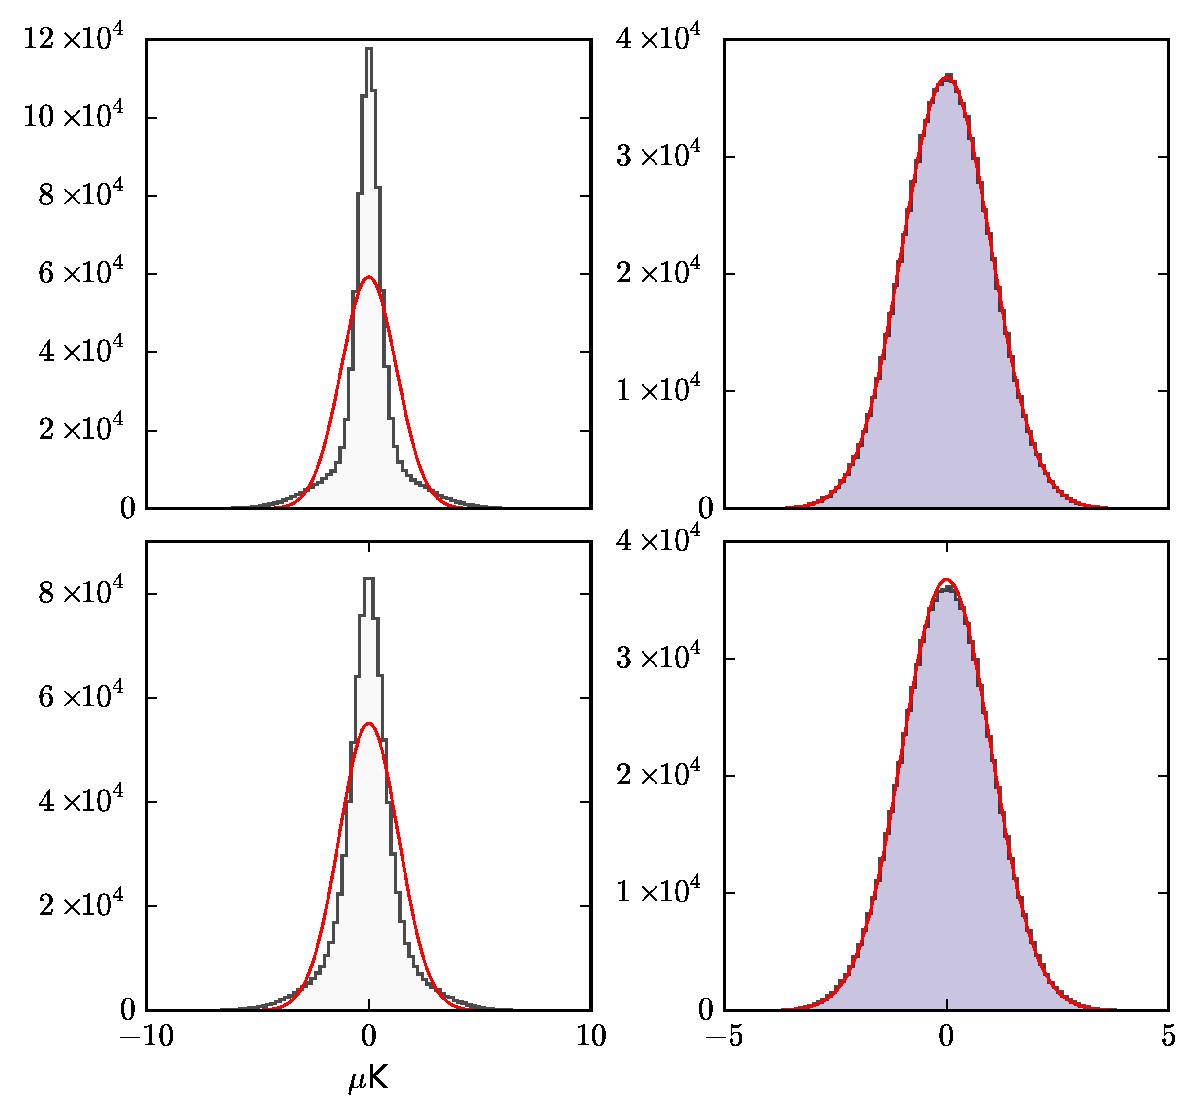
Distribution of noise map values before (left) and after (right) whitening by application of NCVM. The red curve on the left gives the gaussian distribution with stdev equal to that of the data. On the right, the red curve gives the Gaussian distribution with unity variance, the expected ideal result. Top: 70 GHz full mission, realistic simulation. Bottom: Horn pair LFI18/23, full destriping, realistic simulation.
Current usage metrics show cumulative count of Article Views (full-text article views including HTML views, PDF and ePub downloads, according to the available data) and Abstracts Views on Vision4Press platform.
Data correspond to usage on the plateform after 2015. The current usage metrics is available 48-96 hours after online publication and is updated daily on week days.
Initial download of the metrics may take a while.